29
/
en
AIzaSyAYiBZKx7MnpbEhh9jyipgxe19OcubqV5w
April 1, 2024
112340
Costa Rica
CRI
true
2
1
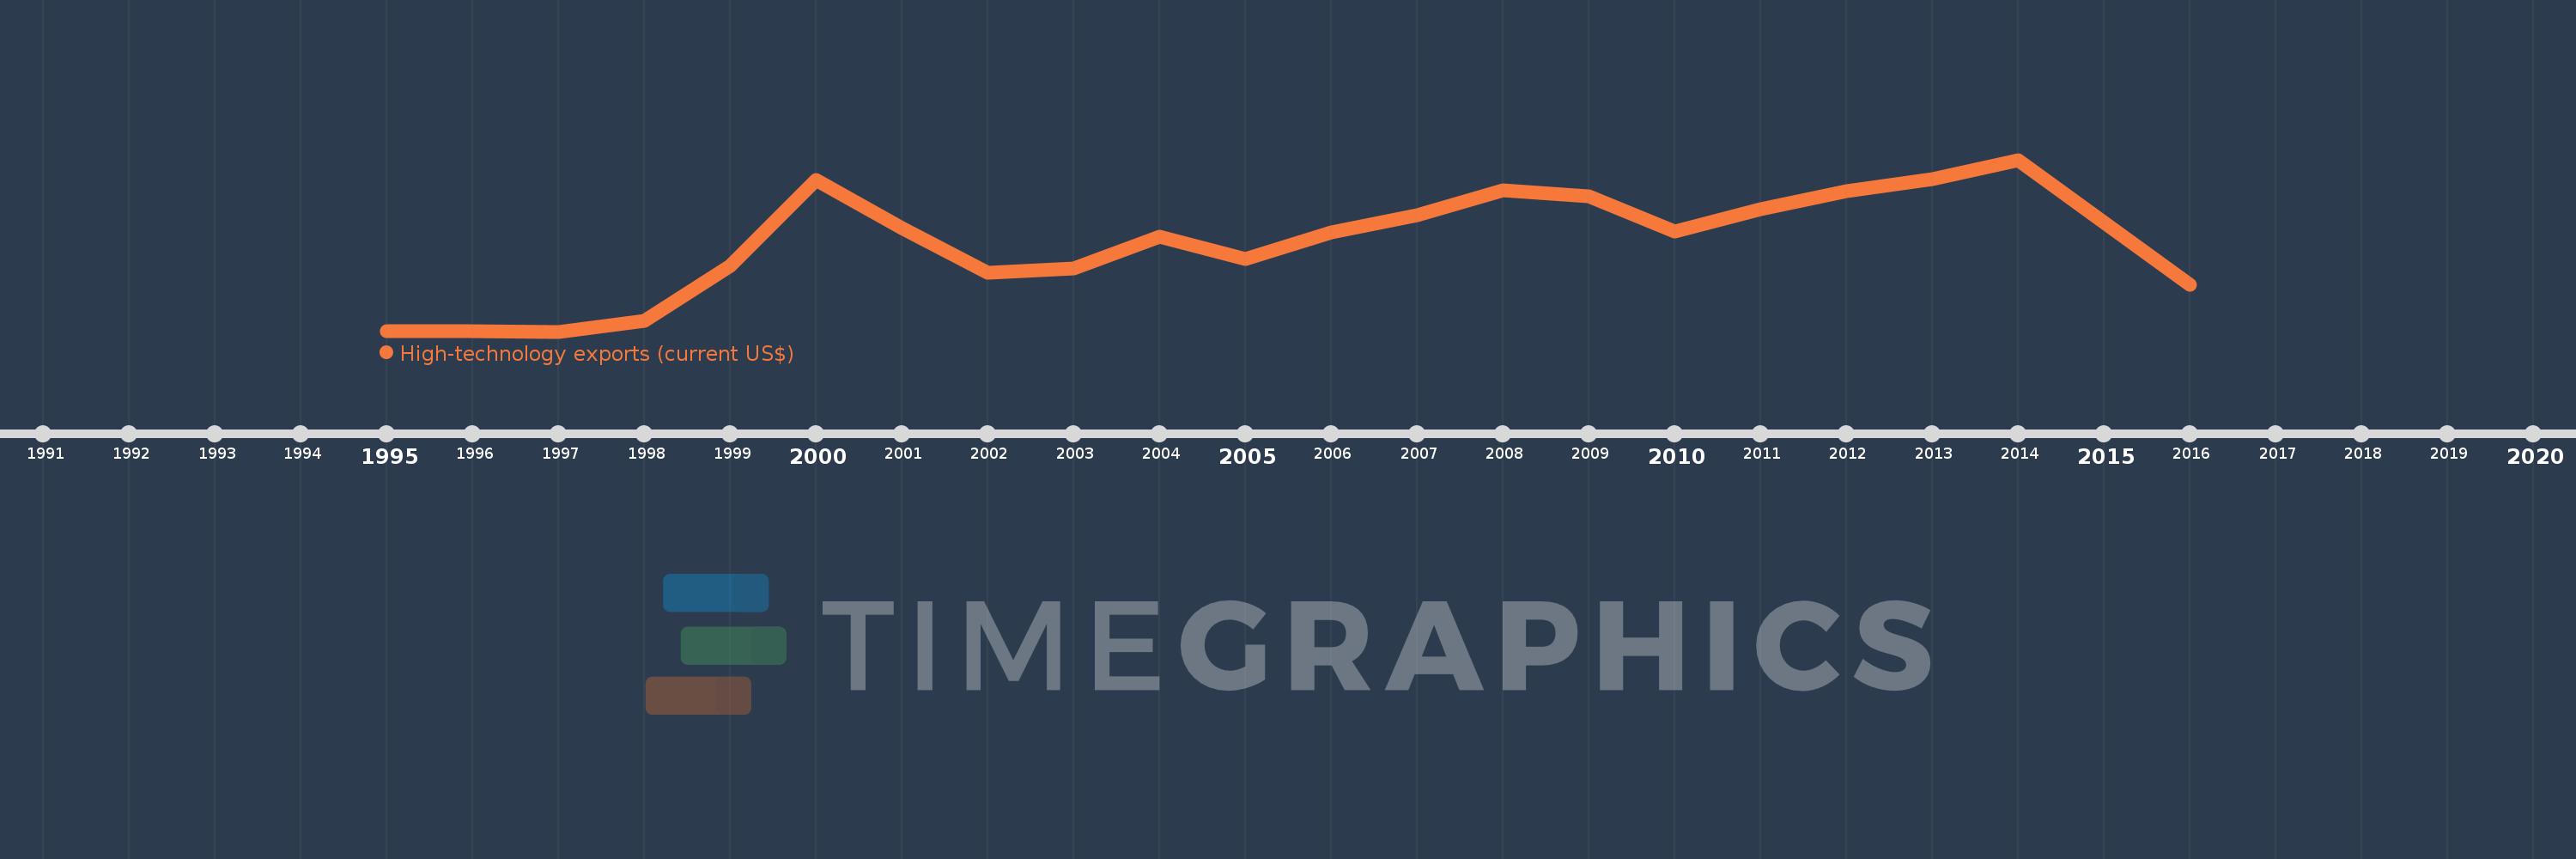
High-technology exports (current US$)
2016,2014,2013,2012,2011,2010,2009,2008,2007,2006,2005,2004,2003,2002,2001,2000,1999,1998,1997,1996,1995
This statistics in other country:
AlbaniaAlgeriaAndorraAntigua and BarbudaArab WorldArgentinaArmeniaArubaAustraliaAustriaAzerbaijanBahamas, TheBahrainBangladeshBarbadosBelarusBelgiumBelizeBeninBermudaBhutanBoliviaBosnia and HerzegovinaBotswanaBrazilBrunei DarussalamBulgariaBurkina FasoBurundiCabo VerdeCambodiaCameroonCanadaCaribbean small statesCentral African RepublicCentral Europe and the BalticsChileChinaColombiaComorosCongo, Rep.Costa RicaCote d'IvoireCroatiaCubaCyprusCzech RepublicDenmarkDjiboutiDominicaDominican RepublicEarly-demographic dividendEast Asia & PacificEcuadorEgypt, Arab Rep.El SalvadorEritreaEstoniaEthiopiaEuro areaEurope & Central AsiaEurope & Central Asia (excluding high income)Europe & Central Asia (IDA & IBRD countries)European UnionFaroe IslandsFijiFinlandFranceFrench PolynesiaGabonGambia, TheGeorgiaGermanyGhanaGreeceGreenlandGrenadaGuatemalaGuineaGuinea-BissauGuyanaHaitiHeavily indebted poor countries (HIPC)High incomeHondurasHong Kong SAR, ChinaHungaryIBRD onlyIcelandIDA & IBRD totalIDA blendIDA onlyIDA totalIndiaIndonesiaIran, Islamic Rep.IraqIrelandIsraelItalyJamaicaJapanJordanKazakhstanKenyaKiribatiKorea, Rep.KuwaitKyrgyz RepublicLate-demographic dividendLatin America & Caribbean Latin America & Caribbean (excluding high income)Latin America & the Caribbean (IDA & IBRD countries)LatviaLebanonLesothoLithuaniaLow & middle incomeLow incomeLower middle incomeLuxembourgMacao SAR, ChinaMacedonia, FYRMadagascarMalawiMalaysiaMaldivesMaliMaltaMauritiusMexicoMiddle East & North AfricaMiddle East & North Africa (excluding high income)Middle East & North Africa (IDA & IBRD countries)Middle incomeMoldovaMongoliaMontenegroMoroccoMozambiqueMyanmarNamibiaNepalNetherlandsNew CaledoniaNew ZealandNicaraguaNigerNigeriaNorth AmericaNorwayOECD membersOmanOther small statesPakistanPalauPanamaPapua New GuineaParaguayPeruPhilippinesPolandPortugalPost-demographic dividendQatarRomaniaRussian FederationRwandaSamoaSao Tome and PrincipeSaudi ArabiaSenegalSerbiaSeychellesSierra LeoneSingaporeSlovak RepublicSloveniaSmall statesSolomon IslandsSouth AfricaSouth AsiaSouth Asia (IDA & IBRD)South SudanSpainSri LankaSt. Kitts and NevisSt. LuciaSt. Vincent and the GrenadinesSub-Saharan Africa Sub-Saharan Africa (excluding high income)Sub-Saharan Africa (IDA & IBRD countries)SudanSurinameSwazilandSwedenSwitzerlandSyrian Arab RepublicTajikistanTanzaniaThailandTimor-LesteTogoTongaTrinidad and TobagoTunisiaTurkeyTurkmenistanTurks and Caicos IslandsTuvaluUgandaUkraineUnited Arab EmiratesUnited KingdomUnited StatesUpper middle incomeUruguayVanuatuVenezuela, RBVietnamWest Bank and GazaWorldYemen, Rep.ZambiaZimbabwe Timeline:
This timeline shows a graph from 1995 to 2016 of Costa Rica. No data until 1994. Number of actual observations by date: 21.
Source name:
World Development Indicators
Source organization:
United Nations, Comtrade database.
Categories, topics:
Private Sector, Science & Technology, Trade
Last updated:
apr 23, 2017
Indicators value changes by year
Minimum:
29.62 mln
jan 1, 1997
Maximum:
3.065 bln
jan 1, 2014
At the date of observation
Value
Absolute change
Change from previous value
jan 1, 1995
33.775 mln
+33.775 mln
0.0%
jan 1, 1996
41.978 mln
+8.203 mln
24.29%
jan 1, 1997
29.62 mln
-12.358 mln
-29.44%
jan 1, 1998
220.196 mln
+190.576 mln
643.41%
jan 1, 1999
1.189 bln
+968.624 mln
439.89%
jan 1, 2000
2.707 bln
+1.518 bln
127.69%
jan 1, 2001
1.859 bln
-847.771 mln
-31.32%
jan 1, 2002
1.071 bln
-788.061 mln
-42.39%
jan 1, 2003
1.146 bln
+75.417 mln
7.04%
jan 1, 2004
1.701 bln
+554.192 mln
48.34%
jan 1, 2005
1.309 bln
-391.56 mln
-23.02%
jan 1, 2006
1.777 bln
+467.776 mln
35.73%
jan 1, 2007
2.091 bln
+313.798 mln
17.66%
jan 1, 2008
2.53 bln
+439.713 mln
21.03%
jan 1, 2009
2.426 bln
-104.28 mln
-4.12%
jan 1, 2010
1.791 bln
-634.663 mln
-26.16%
jan 1, 2011
2.193 bln
+401.935 mln
22.44%
jan 1, 2012
2.512 bln
+318.233 mln
14.51%
jan 1, 2013
2.719 bln
+207.514 mln
8.26%
jan 1, 2014
3.065 bln
+346.003 mln
12.72%
jan 1, 2016
861.602 mln
-2.203 bln
-71.89%
Ranking of countries by current statistics by years


Comments: