29
/
en
AIzaSyAYiBZKx7MnpbEhh9jyipgxe19OcubqV5w
April 1, 2024
248806
Sri Lanka
LKA
true
2
1
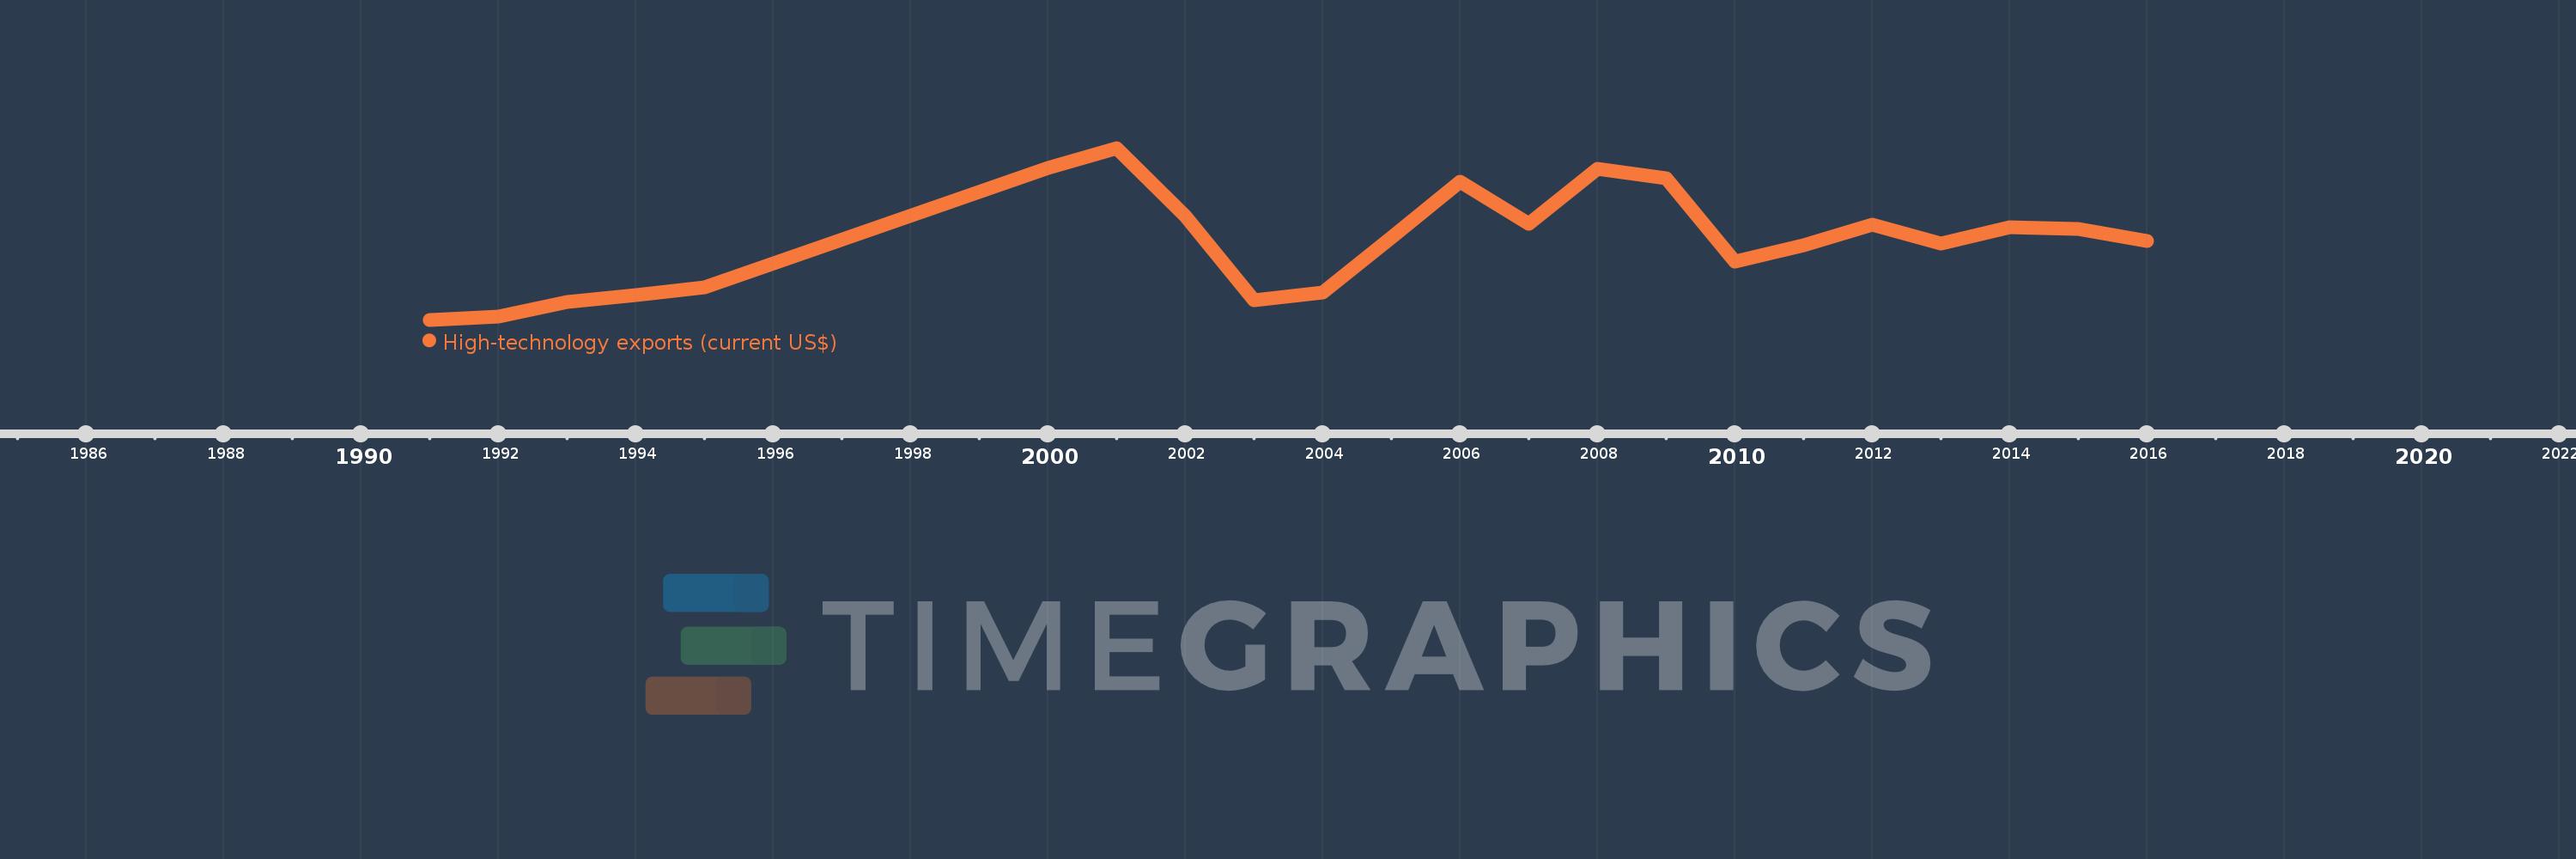
High-technology exports (current US$)
2016,2015,2014,2013,2012,2011,2010,2009,2008,2007,2006,2005,2004,2003,2002,2001,2000,1995,1994,1993,1992,1991
This statistics in other country:
AlbaniaAlgeriaAndorraAntigua and BarbudaArab WorldArgentinaArmeniaArubaAustraliaAustriaAzerbaijanBahamas, TheBahrainBangladeshBarbadosBelarusBelgiumBelizeBeninBermudaBhutanBoliviaBosnia and HerzegovinaBotswanaBrazilBrunei DarussalamBulgariaBurkina FasoBurundiCabo VerdeCambodiaCameroonCanadaCaribbean small statesCentral African RepublicCentral Europe and the BalticsChileChinaColombiaComorosCongo, Rep.Costa RicaCote d'IvoireCroatiaCubaCyprusCzech RepublicDenmarkDjiboutiDominicaDominican RepublicEarly-demographic dividendEast Asia & PacificEcuadorEgypt, Arab Rep.El SalvadorEritreaEstoniaEthiopiaEuro areaEurope & Central AsiaEurope & Central Asia (excluding high income)Europe & Central Asia (IDA & IBRD countries)European UnionFaroe IslandsFijiFinlandFranceFrench PolynesiaGabonGambia, TheGeorgiaGermanyGhanaGreeceGreenlandGrenadaGuatemalaGuineaGuinea-BissauGuyanaHaitiHeavily indebted poor countries (HIPC)High incomeHondurasHong Kong SAR, ChinaHungaryIBRD onlyIcelandIDA & IBRD totalIDA blendIDA onlyIDA totalIndiaIndonesiaIran, Islamic Rep.IraqIrelandIsraelItalyJamaicaJapanJordanKazakhstanKenyaKiribatiKorea, Rep.KuwaitKyrgyz RepublicLate-demographic dividendLatin America & Caribbean Latin America & Caribbean (excluding high income)Latin America & the Caribbean (IDA & IBRD countries)LatviaLebanonLesothoLithuaniaLow & middle incomeLow incomeLower middle incomeLuxembourgMacao SAR, ChinaMacedonia, FYRMadagascarMalawiMalaysiaMaldivesMaliMaltaMauritiusMexicoMiddle East & North AfricaMiddle East & North Africa (excluding high income)Middle East & North Africa (IDA & IBRD countries)Middle incomeMoldovaMongoliaMontenegroMoroccoMozambiqueMyanmarNamibiaNepalNetherlandsNew CaledoniaNew ZealandNicaraguaNigerNigeriaNorth AmericaNorwayOECD membersOmanOther small statesPakistanPalauPanamaPapua New GuineaParaguayPeruPhilippinesPolandPortugalPost-demographic dividendQatarRomaniaRussian FederationRwandaSamoaSao Tome and PrincipeSaudi ArabiaSenegalSerbiaSeychellesSierra LeoneSingaporeSlovak RepublicSloveniaSmall statesSolomon IslandsSouth AfricaSouth AsiaSouth Asia (IDA & IBRD)South SudanSpainSri LankaSt. Kitts and NevisSt. LuciaSt. Vincent and the GrenadinesSub-Saharan Africa Sub-Saharan Africa (excluding high income)Sub-Saharan Africa (IDA & IBRD countries)SudanSurinameSwazilandSwedenSwitzerlandSyrian Arab RepublicTajikistanTanzaniaThailandTimor-LesteTogoTongaTrinidad and TobagoTunisiaTurkeyTurkmenistanTurks and Caicos IslandsTuvaluUgandaUkraineUnited Arab EmiratesUnited KingdomUnited StatesUpper middle incomeUruguayVanuatuVenezuela, RBVietnamWest Bank and GazaWorldYemen, Rep.ZambiaZimbabwe Timeline:
This timeline shows a graph from 1991 to 2016 of Sri Lanka. No data until 1990. Number of actual observations by date: 22.
Source name:
World Development Indicators
Source organization:
United Nations, Comtrade database.
Categories, topics:
Private Sector, Science & Technology, Trade
Last updated:
apr 23, 2017
Indicators value changes by year
Minimum:
6.056 mln
jan 1, 1991
Maximum:
122.747 mln
jan 1, 2001
At the date of observation
Value
Absolute change
Change from previous value
jan 1, 1991
6.056 mln
+6.056 mln
0.0%
jan 1, 1992
8.04 mln
+1.984 mln
32.75%
jan 1, 1993
18.181 mln
+10.141 mln
126.12%
jan 1, 1994
22.901 mln
+4.72 mln
25.96%
jan 1, 1995
27.889 mln
+4.989 mln
21.78%
jan 1, 2000
109.039 mln
+81.15 mln
290.97%
jan 1, 2001
122.747 mln
+13.708 mln
12.57%
jan 1, 2002
76.287 mln
-46.459 mln
-37.85%
jan 1, 2003
19.282 mln
-57.005 mln
-74.72%
jan 1, 2004
24.62 mln
+5.338 mln
27.68%
jan 1, 2005
61.775 mln
+37.156 mln
150.92%
jan 1, 2006
99.738 mln
+37.963 mln
61.45%
jan 1, 2007
71.512 mln
-28.226 mln
-28.3%
jan 1, 2008
108.639 mln
+37.127 mln
51.92%
jan 1, 2009
102.24 mln
-6.4 mln
-5.89%
jan 1, 2010
45.503 mln
-56.737 mln
-55.49%
jan 1, 2011
56.678 mln
+11.176 mln
24.56%
jan 1, 2012
70.746 mln
+14.068 mln
24.82%
jan 1, 2013
57.824 mln
-12.923 mln
-18.27%
jan 1, 2014
69.143 mln
+11.319 mln
19.57%
jan 1, 2015
67.648 mln
-1.495 mln
-2.16%
jan 1, 2016
59.295 mln
-8.353 mln
-12.35%
Ranking of countries by current statistics by years


Comments: