29
/
en
AIzaSyAYiBZKx7MnpbEhh9jyipgxe19OcubqV5w
April 1, 2024
133234
Finland
FIN
true
2
1
High-technology exports (current US$)
2016,2015,2014,2013,2012,2011,2010,2009,2008,2007,2006,2005,2004,2003,2002,2001,2000,1999,1998,1997,1996,1995,1994,1993,1992,1991,1990,1989
This statistics in other country:
AlbaniaAlgeriaAndorraAntigua and BarbudaArab WorldArgentinaArmeniaArubaAustraliaAustriaAzerbaijanBahamas, TheBahrainBangladeshBarbadosBelarusBelgiumBelizeBeninBermudaBhutanBoliviaBosnia and HerzegovinaBotswanaBrazilBrunei DarussalamBulgariaBurkina FasoBurundiCabo VerdeCambodiaCameroonCanadaCaribbean small statesCentral African RepublicCentral Europe and the BalticsChileChinaColombiaComorosCongo, Rep.Costa RicaCote d'IvoireCroatiaCubaCyprusCzech RepublicDenmarkDjiboutiDominicaDominican RepublicEarly-demographic dividendEast Asia & PacificEcuadorEgypt, Arab Rep.El SalvadorEritreaEstoniaEthiopiaEuro areaEurope & Central AsiaEurope & Central Asia (excluding high income)Europe & Central Asia (IDA & IBRD countries)European UnionFaroe IslandsFijiFinlandFranceFrench PolynesiaGabonGambia, TheGeorgiaGermanyGhanaGreeceGreenlandGrenadaGuatemalaGuineaGuinea-BissauGuyanaHaitiHeavily indebted poor countries (HIPC)High incomeHondurasHong Kong SAR, ChinaHungaryIBRD onlyIcelandIDA & IBRD totalIDA blendIDA onlyIDA totalIndiaIndonesiaIran, Islamic Rep.IraqIrelandIsraelItalyJamaicaJapanJordanKazakhstanKenyaKiribatiKorea, Rep.KuwaitKyrgyz RepublicLate-demographic dividendLatin America & Caribbean Latin America & Caribbean (excluding high income)Latin America & the Caribbean (IDA & IBRD countries)LatviaLebanonLesothoLithuaniaLow & middle incomeLow incomeLower middle incomeLuxembourgMacao SAR, ChinaMacedonia, FYRMadagascarMalawiMalaysiaMaldivesMaliMaltaMauritiusMexicoMiddle East & North AfricaMiddle East & North Africa (excluding high income)Middle East & North Africa (IDA & IBRD countries)Middle incomeMoldovaMongoliaMontenegroMoroccoMozambiqueMyanmarNamibiaNepalNetherlandsNew CaledoniaNew ZealandNicaraguaNigerNigeriaNorth AmericaNorwayOECD membersOmanOther small statesPakistanPalauPanamaPapua New GuineaParaguayPeruPhilippinesPolandPortugalPost-demographic dividendQatarRomaniaRussian FederationRwandaSamoaSao Tome and PrincipeSaudi ArabiaSenegalSerbiaSeychellesSierra LeoneSingaporeSlovak RepublicSloveniaSmall statesSolomon IslandsSouth AfricaSouth AsiaSouth Asia (IDA & IBRD)South SudanSpainSri LankaSt. Kitts and NevisSt. LuciaSt. Vincent and the GrenadinesSub-Saharan Africa Sub-Saharan Africa (excluding high income)Sub-Saharan Africa (IDA & IBRD countries)SudanSurinameSwazilandSwedenSwitzerlandSyrian Arab RepublicTajikistanTanzaniaThailandTimor-LesteTogoTongaTrinidad and TobagoTunisiaTurkeyTurkmenistanTurks and Caicos IslandsTuvaluUgandaUkraineUnited Arab EmiratesUnited KingdomUnited StatesUpper middle incomeUruguayVanuatuVenezuela, RBVietnamWest Bank and GazaWorldYemen, Rep.ZambiaZimbabwe Timeline:
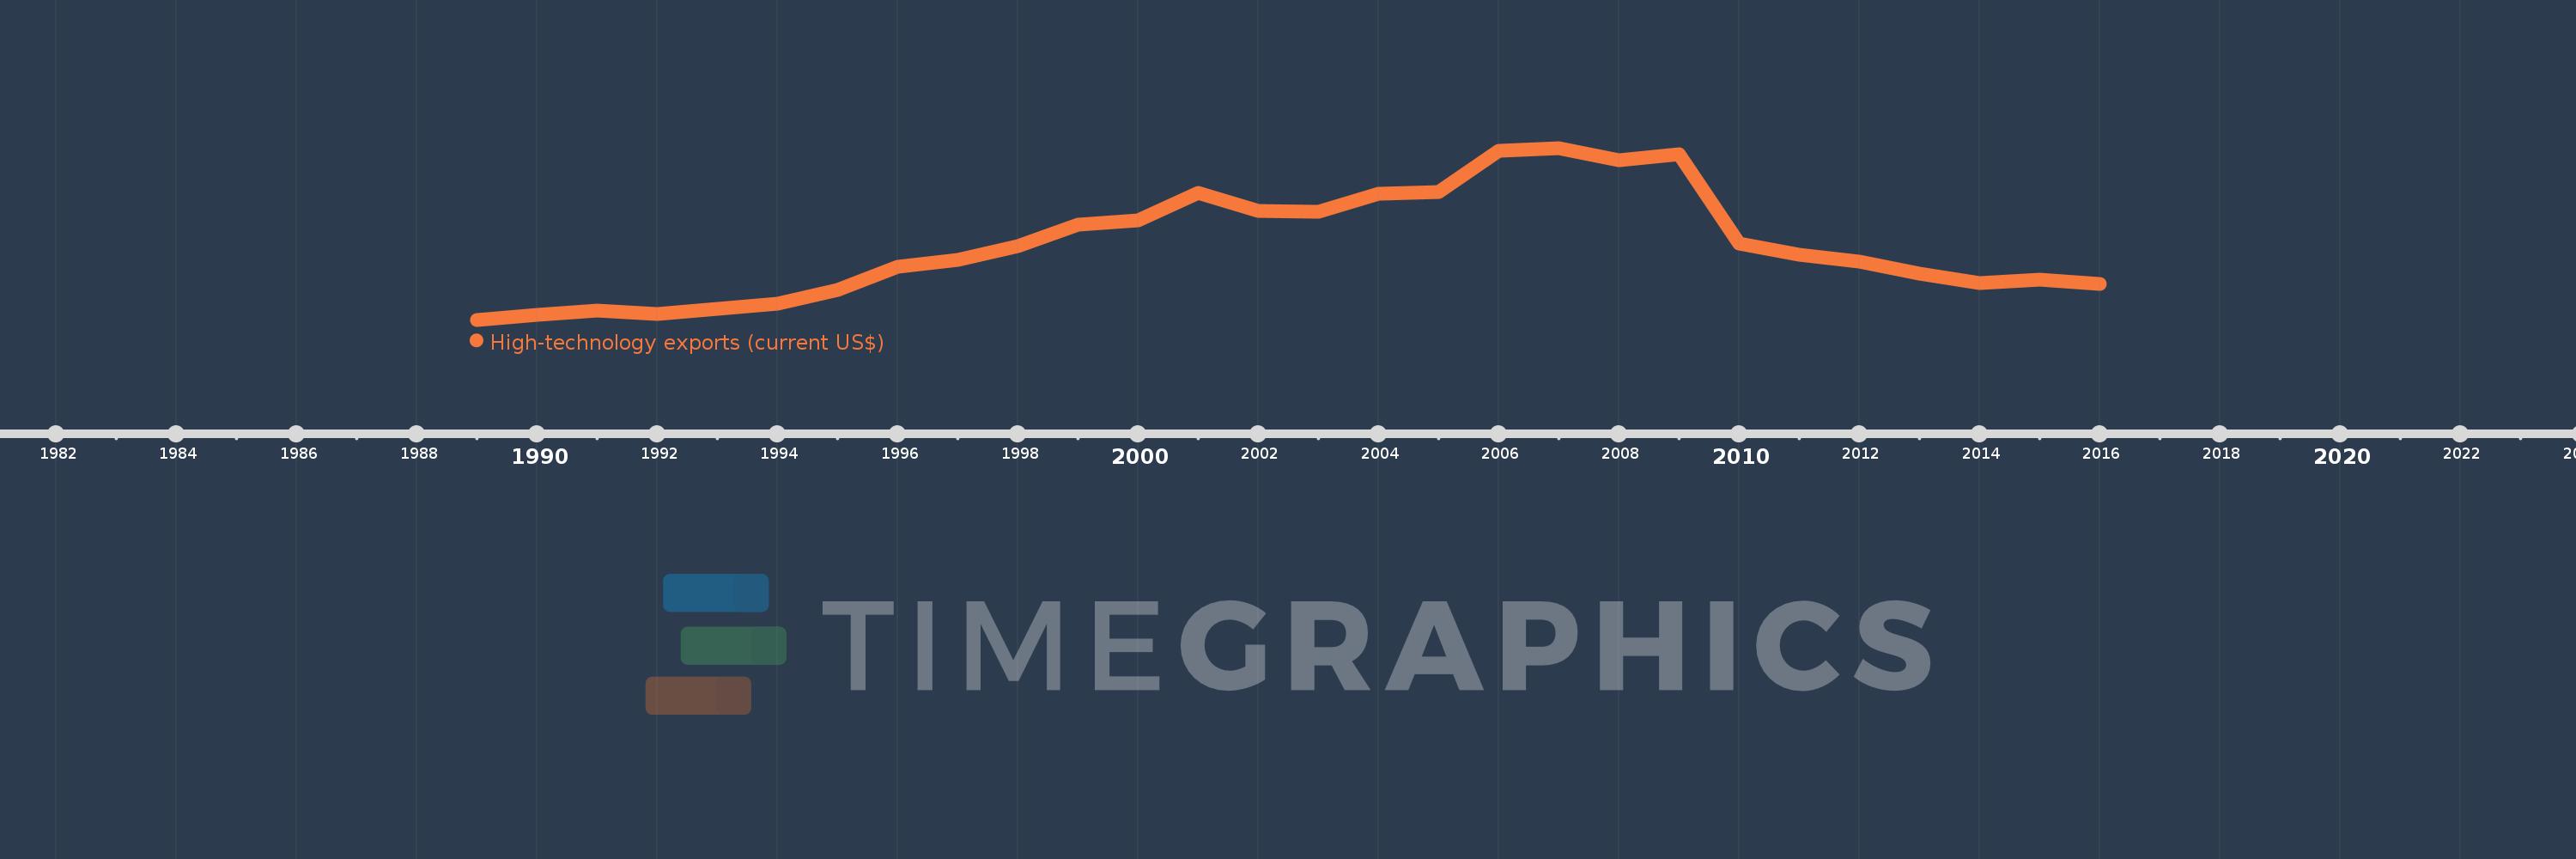
This timeline shows a graph from 1989 to 2016 of Finland. No data until 1988. Number of actual observations by date: 28.
Source name:
World Development Indicators
Source organization:
United Nations, Comtrade database.
Categories, topics:
Private Sector, Science & Technology, Trade
Last updated:
apr 23, 2017
Indicators value changes by year
Minimum:
941.654 mln
jan 1, 1989
Maximum:
13.987 bln
jan 1, 2007
At the date of observation
Value
Absolute change
Change from previous value
jan 1, 1989
941.654 mln
+941.654 mln
0.0%
jan 1, 1990
1.304 bln
+362.801 mln
38.53%
jan 1, 1991
1.668 bln
+363.179 mln
27.84%
jan 1, 1992
1.365 bln
-302.235 mln
-18.12%
jan 1, 1993
1.798 bln
+432.899 mln
31.7%
jan 1, 1994
2.159 bln
+361.118 mln
20.08%
jan 1, 1995
3.191 bln
+1.031 bln
47.76%
jan 1, 1996
4.949 bln
+1.758 bln
55.11%
jan 1, 1997
5.517 bln
+567.898 mln
11.47%
jan 1, 1998
6.562 bln
+1.045 bln
18.93%
jan 1, 1999
8.15 bln
+1.588 bln
24.2%
jan 1, 2000
8.482 bln
+332.088 mln
4.07%
jan 1, 2001
10.553 bln
+2.071 bln
24.42%
jan 1, 2002
9.218 bln
-1.335 bln
-12.65%
jan 1, 2003
9.119 bln
-98.32 mln
-1.07%
jan 1, 2004
10.483 bln
+1.364 bln
14.95%
jan 1, 2005
10.616 bln
+133.267 mln
1.27%
jan 1, 2006
13.752 bln
+3.136 bln
29.54%
jan 1, 2007
13.987 bln
+234.375 mln
1.7%
jan 1, 2008
13.026 bln
-960.909 mln
-6.87%
jan 1, 2009
13.506 bln
+479.831 mln
3.68%
jan 1, 2010
6.747 bln
-6.759 bln
-50.04%
jan 1, 2011
5.853 bln
-893.346 mln
-13.24%
jan 1, 2012
5.358 bln
-495.709 mln
-8.47%
jan 1, 2013
4.448 bln
-910.152 mln
-16.99%
jan 1, 2014
3.725 bln
-722.827 mln
-16.25%
jan 1, 2015
3.961 bln
+236.534 mln
6.35%
jan 1, 2016
3.633 bln
-328.392 mln
-8.29%
Ranking of countries by current statistics by years


Comments: