29
/
en
AIzaSyAYiBZKx7MnpbEhh9jyipgxe19OcubqV5w
April 1, 2024
139358
Germany
DEU
true
2
1
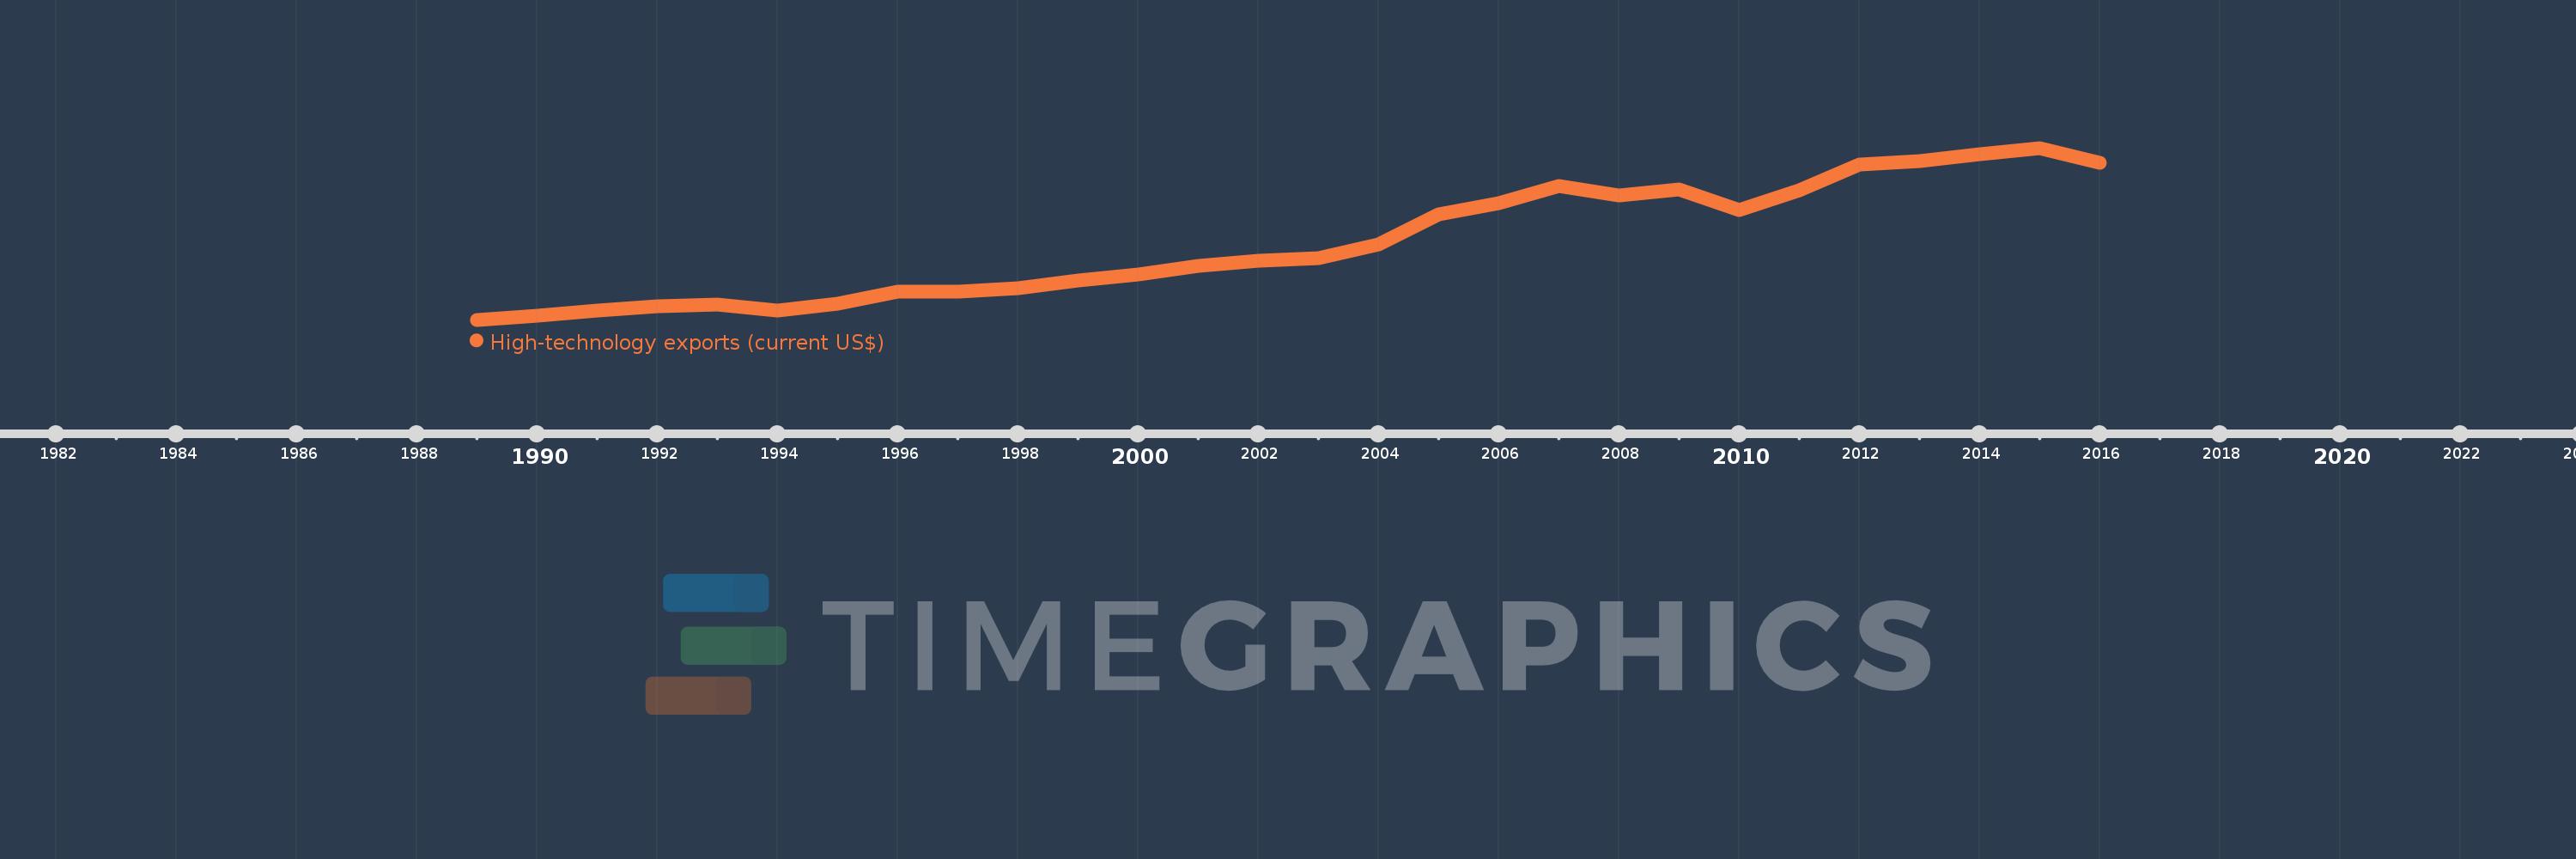
High-technology exports (current US$)
2016,2015,2014,2013,2012,2011,2010,2009,2008,2007,2006,2005,2004,2003,2002,2001,2000,1999,1998,1997,1996,1995,1994,1993,1992,1991,1990,1989
This statistics in other country:
AlbaniaAlgeriaAndorraAntigua and BarbudaArab WorldArgentinaArmeniaArubaAustraliaAustriaAzerbaijanBahamas, TheBahrainBangladeshBarbadosBelarusBelgiumBelizeBeninBermudaBhutanBoliviaBosnia and HerzegovinaBotswanaBrazilBrunei DarussalamBulgariaBurkina FasoBurundiCabo VerdeCambodiaCameroonCanadaCaribbean small statesCentral African RepublicCentral Europe and the BalticsChileChinaColombiaComorosCongo, Rep.Costa RicaCote d'IvoireCroatiaCubaCyprusCzech RepublicDenmarkDjiboutiDominicaDominican RepublicEarly-demographic dividendEast Asia & PacificEcuadorEgypt, Arab Rep.El SalvadorEritreaEstoniaEthiopiaEuro areaEurope & Central AsiaEurope & Central Asia (excluding high income)Europe & Central Asia (IDA & IBRD countries)European UnionFaroe IslandsFijiFinlandFranceFrench PolynesiaGabonGambia, TheGeorgiaGermanyGhanaGreeceGreenlandGrenadaGuatemalaGuineaGuinea-BissauGuyanaHaitiHeavily indebted poor countries (HIPC)High incomeHondurasHong Kong SAR, ChinaHungaryIBRD onlyIcelandIDA & IBRD totalIDA blendIDA onlyIDA totalIndiaIndonesiaIran, Islamic Rep.IraqIrelandIsraelItalyJamaicaJapanJordanKazakhstanKenyaKiribatiKorea, Rep.KuwaitKyrgyz RepublicLate-demographic dividendLatin America & Caribbean Latin America & Caribbean (excluding high income)Latin America & the Caribbean (IDA & IBRD countries)LatviaLebanonLesothoLithuaniaLow & middle incomeLow incomeLower middle incomeLuxembourgMacao SAR, ChinaMacedonia, FYRMadagascarMalawiMalaysiaMaldivesMaliMaltaMauritiusMexicoMiddle East & North AfricaMiddle East & North Africa (excluding high income)Middle East & North Africa (IDA & IBRD countries)Middle incomeMoldovaMongoliaMontenegroMoroccoMozambiqueMyanmarNamibiaNepalNetherlandsNew CaledoniaNew ZealandNicaraguaNigerNigeriaNorth AmericaNorwayOECD membersOmanOther small statesPakistanPalauPanamaPapua New GuineaParaguayPeruPhilippinesPolandPortugalPost-demographic dividendQatarRomaniaRussian FederationRwandaSamoaSao Tome and PrincipeSaudi ArabiaSenegalSerbiaSeychellesSierra LeoneSingaporeSlovak RepublicSloveniaSmall statesSolomon IslandsSouth AfricaSouth AsiaSouth Asia (IDA & IBRD)South SudanSpainSri LankaSt. Kitts and NevisSt. LuciaSt. Vincent and the GrenadinesSub-Saharan Africa Sub-Saharan Africa (excluding high income)Sub-Saharan Africa (IDA & IBRD countries)SudanSurinameSwazilandSwedenSwitzerlandSyrian Arab RepublicTajikistanTanzaniaThailandTimor-LesteTogoTongaTrinidad and TobagoTunisiaTurkeyTurkmenistanTurks and Caicos IslandsTuvaluUgandaUkraineUnited Arab EmiratesUnited KingdomUnited StatesUpper middle incomeUruguayVanuatuVenezuela, RBVietnamWest Bank and GazaWorldYemen, Rep.ZambiaZimbabwe Timeline:
This timeline shows a graph from 1989 to 2016 of Germany. No data until 1988. Number of actual observations by date: 28.
Source name:
World Development Indicators
Source organization:
United Nations, Comtrade database.
Categories, topics:
Private Sector, Science & Technology, Trade
Last updated:
apr 23, 2017
Indicators value changes by year
Minimum:
33.64 bln
jan 1, 1989
Maximum:
199.718 bln
jan 1, 2015
At the date of observation
Value
Absolute change
Change from previous value
jan 1, 1989
33.64 bln
+33.64 bln
0.0%
jan 1, 1990
37.372 bln
+3.732 bln
11.09%
jan 1, 1991
42.468 bln
+5.095 bln
13.63%
jan 1, 1992
46.425 bln
+3.957 bln
9.32%
jan 1, 1993
48.069 bln
+1.644 bln
3.54%
jan 1, 1994
42.605 bln
-5.464 bln
-11.37%
jan 1, 1995
49.515 bln
+6.91 bln
16.22%
jan 1, 1996
60.582 bln
+11.067 bln
22.35%
jan 1, 1997
60.953 bln
+371.498 mln
0.61%
jan 1, 1998
64.075 bln
+3.122 bln
5.12%
jan 1, 1999
71.627 bln
+7.552 bln
11.79%
jan 1, 2000
77.188 bln
+5.561 bln
7.76%
jan 1, 2001
85.542 bln
+8.353 bln
10.82%
jan 1, 2002
90.556 bln
+5.015 bln
5.86%
jan 1, 2003
93.578 bln
+3.021 bln
3.34%
jan 1, 2004
106.203 bln
+12.626 bln
13.49%
jan 1, 2005
135.678 bln
+29.475 bln
27.75%
jan 1, 2006
146.389 bln
+10.711 bln
7.89%
jan 1, 2007
163.169 bln
+16.781 bln
11.46%
jan 1, 2008
153.419 bln
-9.751 bln
-5.98%
jan 1, 2009
159.812 bln
+6.393 bln
4.17%
jan 1, 2010
139.961 bln
-19.851 bln
-12.42%
jan 1, 2011
158.507 bln
+18.546 bln
13.25%
jan 1, 2012
183.371 bln
+24.864 bln
15.69%
jan 1, 2013
187.016 bln
+3.644 bln
1.99%
jan 1, 2014
193.799 bln
+6.784 bln
3.63%
jan 1, 2015
199.718 bln
+5.919 bln
3.05%
jan 1, 2016
185.556 bln
-14.162 bln
-7.09%
Ranking of countries by current statistics by years


Comments: