29
/
en
AIzaSyAYiBZKx7MnpbEhh9jyipgxe19OcubqV5w
April 1, 2024
42449
Latin America & Caribbean (excluding high income)
LAC
false
2
1
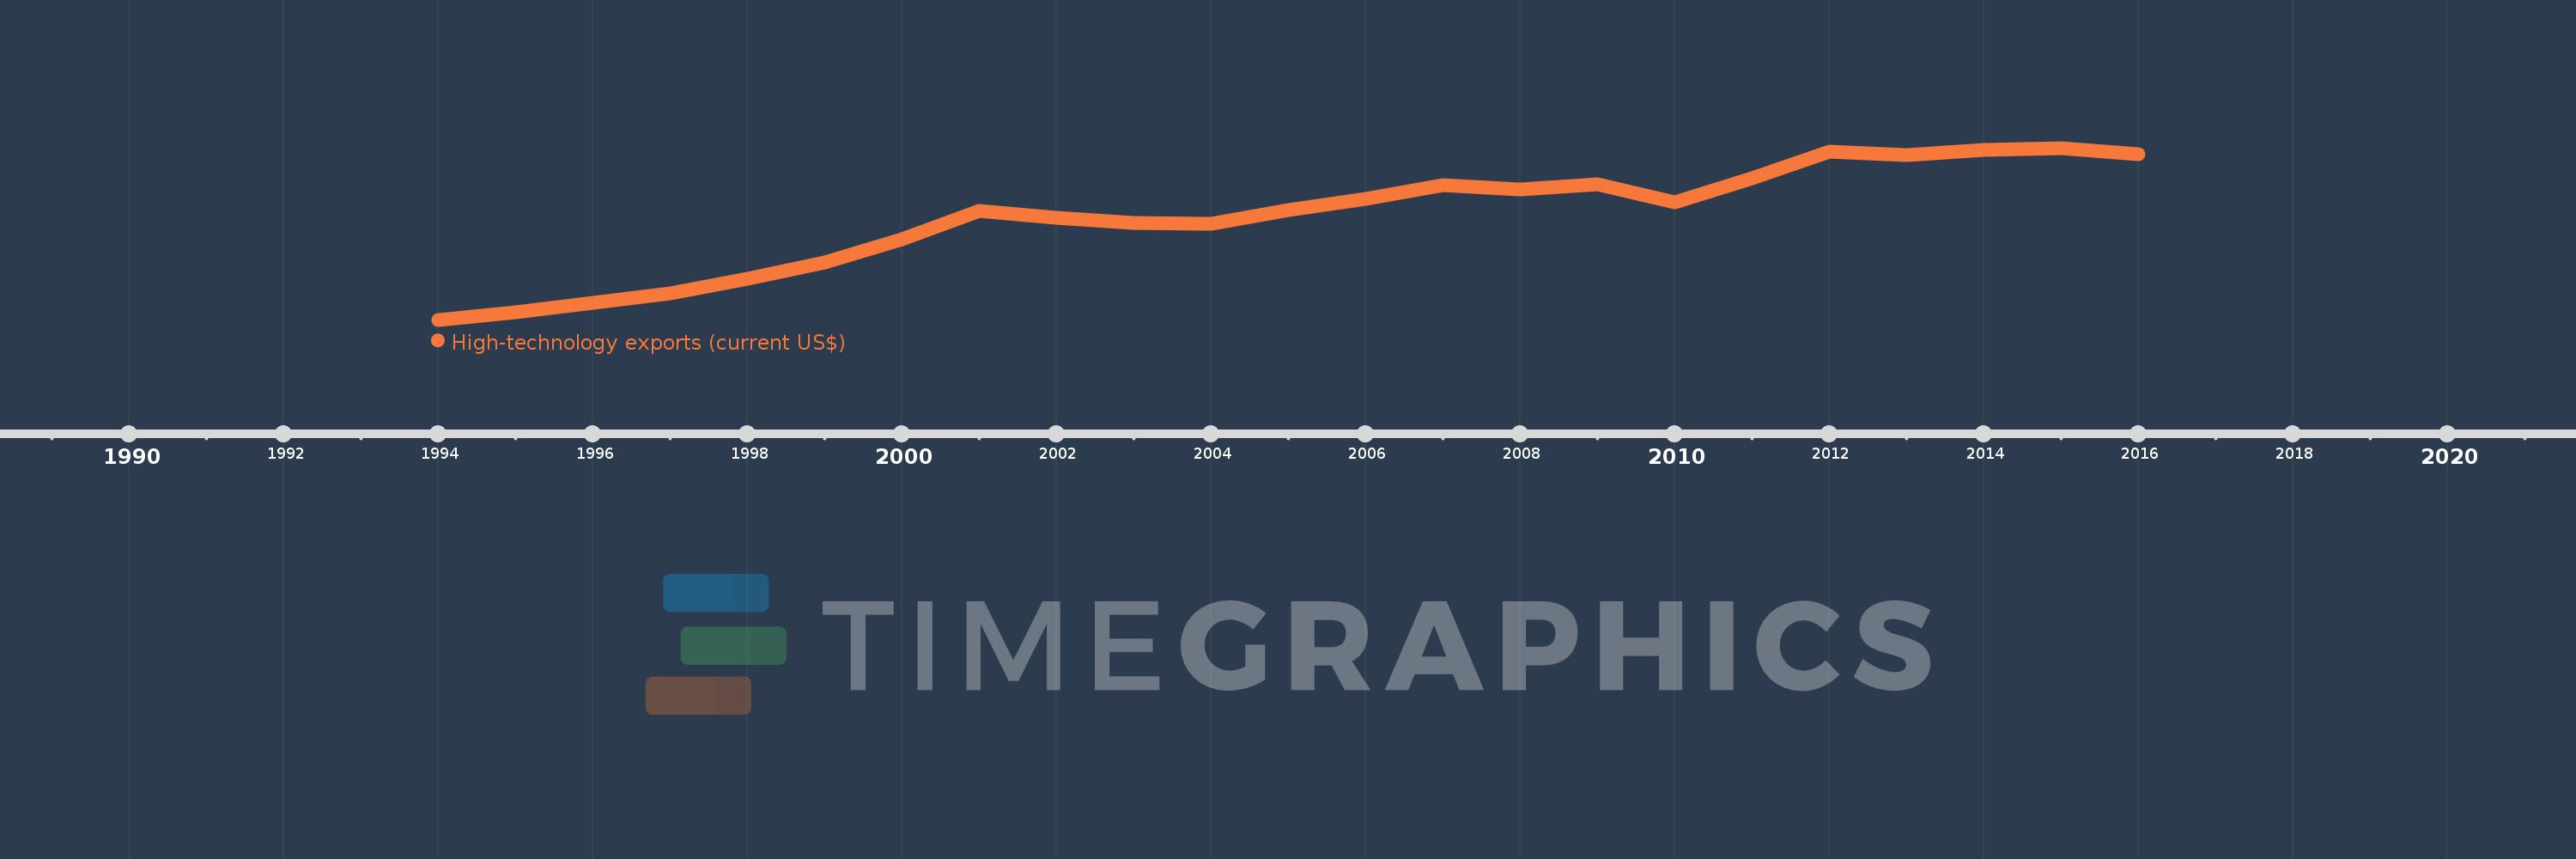
High-technology exports (current US$)
2016,2015,2014,2013,2012,2011,2010,2009,2008,2007,2006,2005,2004,2003,2002,2001,2000,1999,1998,1997,1996,1995,1994
This statistics in other country:
AlbaniaAlgeriaAndorraAntigua and BarbudaArab WorldArgentinaArmeniaArubaAustraliaAustriaAzerbaijanBahamas, TheBahrainBangladeshBarbadosBelarusBelgiumBelizeBeninBermudaBhutanBoliviaBosnia and HerzegovinaBotswanaBrazilBrunei DarussalamBulgariaBurkina FasoBurundiCabo VerdeCambodiaCameroonCanadaCaribbean small statesCentral African RepublicCentral Europe and the BalticsChileChinaColombiaComorosCongo, Rep.Costa RicaCote d'IvoireCroatiaCubaCyprusCzech RepublicDenmarkDjiboutiDominicaDominican RepublicEarly-demographic dividendEast Asia & PacificEcuadorEgypt, Arab Rep.El SalvadorEritreaEstoniaEthiopiaEuro areaEurope & Central AsiaEurope & Central Asia (excluding high income)Europe & Central Asia (IDA & IBRD countries)European UnionFaroe IslandsFijiFinlandFranceFrench PolynesiaGabonGambia, TheGeorgiaGermanyGhanaGreeceGreenlandGrenadaGuatemalaGuineaGuinea-BissauGuyanaHaitiHeavily indebted poor countries (HIPC)High incomeHondurasHong Kong SAR, ChinaHungaryIBRD onlyIcelandIDA & IBRD totalIDA blendIDA onlyIDA totalIndiaIndonesiaIran, Islamic Rep.IraqIrelandIsraelItalyJamaicaJapanJordanKazakhstanKenyaKiribatiKorea, Rep.KuwaitKyrgyz RepublicLate-demographic dividendLatin America & Caribbean Latin America & Caribbean (excluding high income)Latin America & the Caribbean (IDA & IBRD countries)LatviaLebanonLesothoLithuaniaLow & middle incomeLow incomeLower middle incomeLuxembourgMacao SAR, ChinaMacedonia, FYRMadagascarMalawiMalaysiaMaldivesMaliMaltaMauritiusMexicoMiddle East & North AfricaMiddle East & North Africa (excluding high income)Middle East & North Africa (IDA & IBRD countries)Middle incomeMoldovaMongoliaMontenegroMoroccoMozambiqueMyanmarNamibiaNepalNetherlandsNew CaledoniaNew ZealandNicaraguaNigerNigeriaNorth AmericaNorwayOECD membersOmanOther small statesPakistanPalauPanamaPapua New GuineaParaguayPeruPhilippinesPolandPortugalPost-demographic dividendQatarRomaniaRussian FederationRwandaSamoaSao Tome and PrincipeSaudi ArabiaSenegalSerbiaSeychellesSierra LeoneSingaporeSlovak RepublicSloveniaSmall statesSolomon IslandsSouth AfricaSouth AsiaSouth Asia (IDA & IBRD)South SudanSpainSri LankaSt. Kitts and NevisSt. LuciaSt. Vincent and the GrenadinesSub-Saharan Africa Sub-Saharan Africa (excluding high income)Sub-Saharan Africa (IDA & IBRD countries)SudanSurinameSwazilandSwedenSwitzerlandSyrian Arab RepublicTajikistanTanzaniaThailandTimor-LesteTogoTongaTrinidad and TobagoTunisiaTurkeyTurkmenistanTurks and Caicos IslandsTuvaluUgandaUkraineUnited Arab EmiratesUnited KingdomUnited StatesUpper middle incomeUruguayVanuatuVenezuela, RBVietnamWest Bank and GazaWorldYemen, Rep.ZambiaZimbabwe Timeline:
This timeline shows a graph from 1994 to 2016 of Latin America & Caribbean (excluding high income). No data until 1993. Number of actual observations by date: 23.
Source name:
World Development Indicators
Source organization:
United Nations, Comtrade database.
Categories, topics:
Private Sector, Science & Technology, Trade
Last updated:
apr 23, 2017
Indicators value changes by year
Minimum:
5.92 bln
jan 1, 1994
Maximum:
60.838 bln
jan 1, 2015
At the date of observation
Value
Absolute change
Change from previous value
jan 1, 1994
5.92 bln
+5.92 bln
0.0%
jan 1, 1995
8.229 bln
+2.309 bln
39.01%
jan 1, 1996
11.352 bln
+3.122 bln
37.94%
jan 1, 1997
14.374 bln
+3.022 bln
26.62%
jan 1, 1998
18.965 bln
+4.591 bln
31.94%
jan 1, 1999
24.327 bln
+5.362 bln
28.27%
jan 1, 2000
31.651 bln
+7.324 bln
30.11%
jan 1, 2001
40.619 bln
+8.967 bln
28.33%
jan 1, 2002
38.4 bln
-2.219 bln
-5.46%
jan 1, 2003
36.786 bln
-1.614 bln
-4.2%
jan 1, 2004
36.545 bln
-240.575 mln
-0.65%
jan 1, 2005
40.997 bln
+4.452 bln
12.18%
jan 1, 2006
44.502 bln
+3.505 bln
8.55%
jan 1, 2007
48.902 bln
+4.4 bln
9.89%
jan 1, 2008
47.622 bln
-1.28 bln
-2.62%
jan 1, 2009
49.332 bln
+1.71 bln
3.59%
jan 1, 2010
43.555 bln
-5.776 bln
-11.71%
jan 1, 2011
51.138 bln
+7.583 bln
17.41%
jan 1, 2012
59.755 bln
+8.617 bln
16.85%
jan 1, 2013
58.566 bln
-1.189 bln
-1.99%
jan 1, 2014
60.285 bln
+1.718 bln
2.93%
jan 1, 2015
60.838 bln
+553.276 mln
0.92%
jan 1, 2016
58.7 bln
-2.138 bln
-3.51%
Ranking of countries by current statistics by years


Comments: