29
/
en
AIzaSyAYiBZKx7MnpbEhh9jyipgxe19OcubqV5w
April 1, 2024
153630
Iceland
ISL
true
2
1
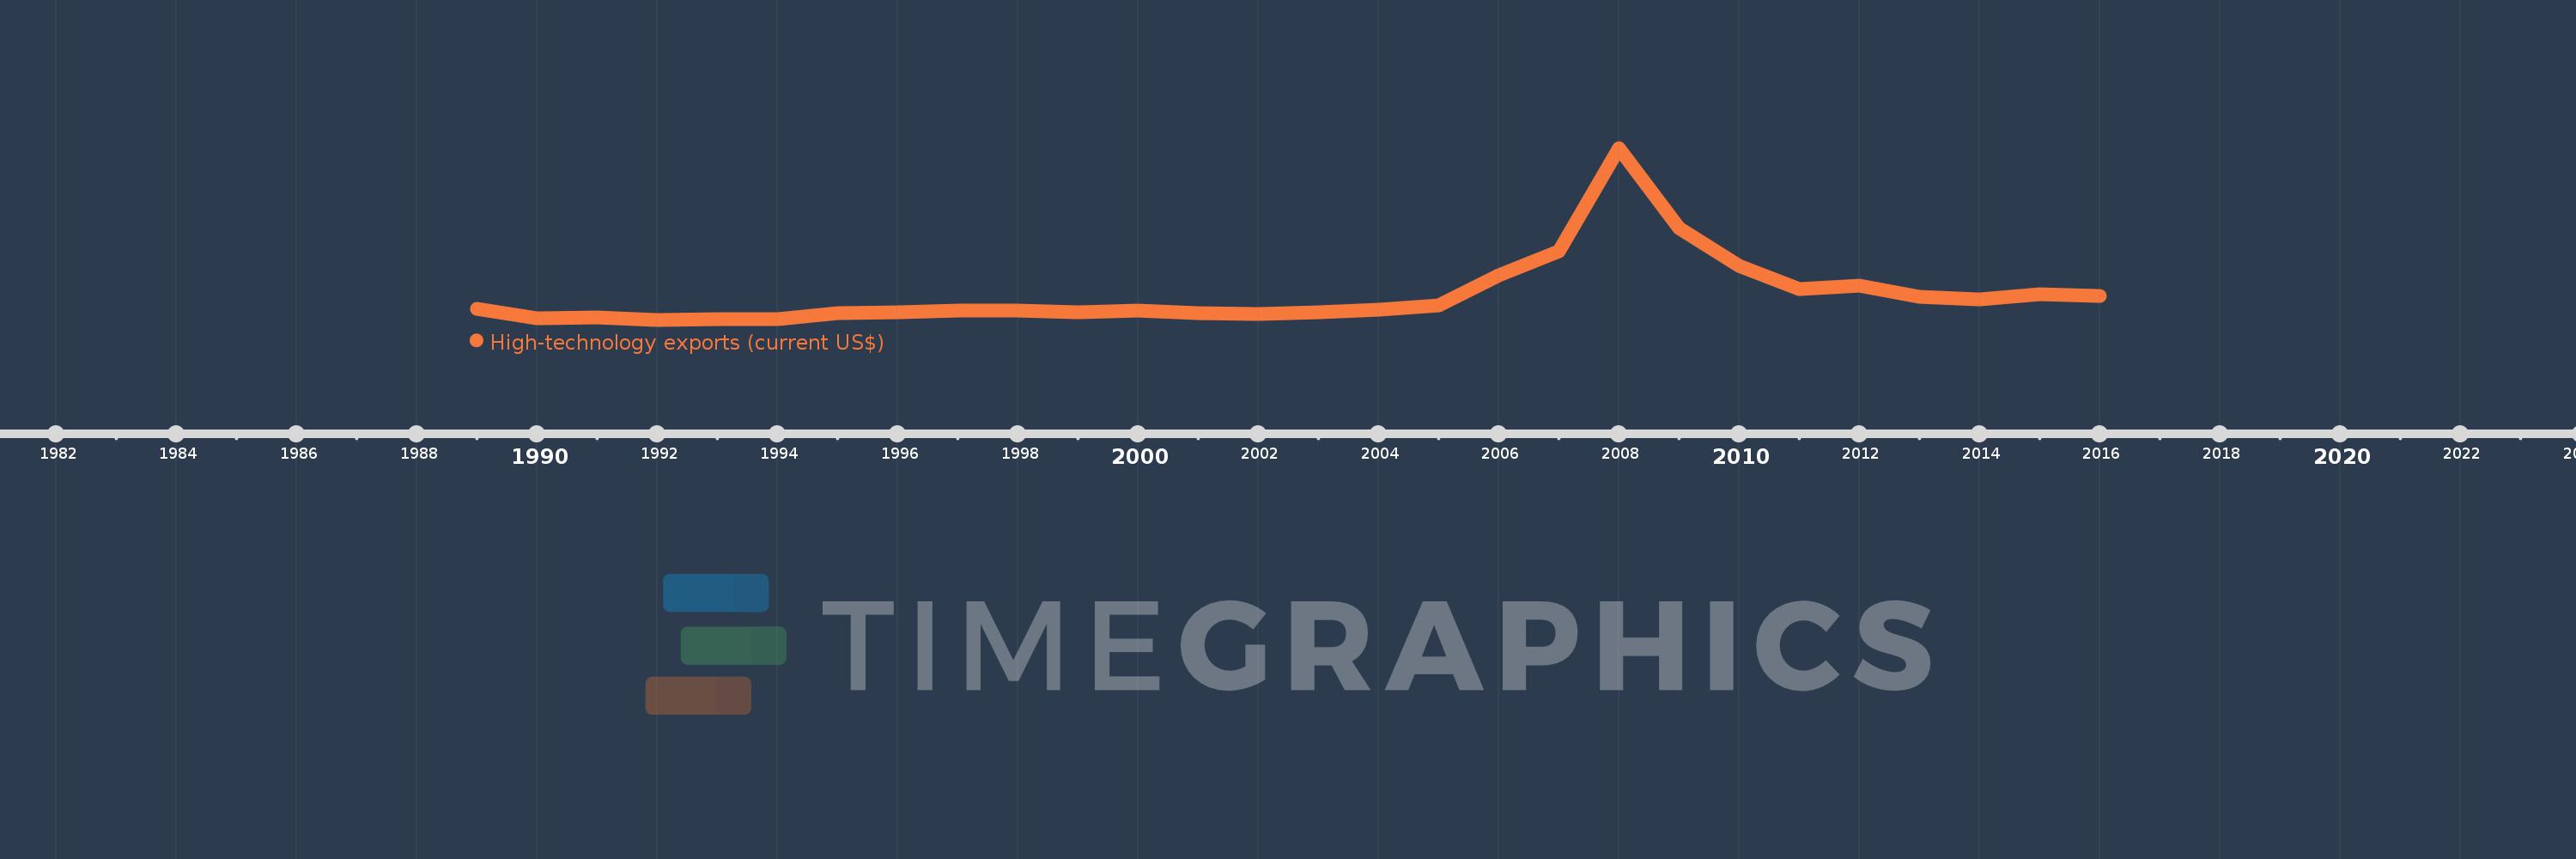
High-technology exports (current US$)
2016,2015,2014,2013,2012,2011,2010,2009,2008,2007,2006,2005,2004,2003,2002,2001,2000,1999,1998,1997,1996,1995,1994,1993,1992,1991,1990,1989
This statistics in other country:
AlbaniaAlgeriaAndorraAntigua and BarbudaArab WorldArgentinaArmeniaArubaAustraliaAustriaAzerbaijanBahamas, TheBahrainBangladeshBarbadosBelarusBelgiumBelizeBeninBermudaBhutanBoliviaBosnia and HerzegovinaBotswanaBrazilBrunei DarussalamBulgariaBurkina FasoBurundiCabo VerdeCambodiaCameroonCanadaCaribbean small statesCentral African RepublicCentral Europe and the BalticsChileChinaColombiaComorosCongo, Rep.Costa RicaCote d'IvoireCroatiaCubaCyprusCzech RepublicDenmarkDjiboutiDominicaDominican RepublicEarly-demographic dividendEast Asia & PacificEcuadorEgypt, Arab Rep.El SalvadorEritreaEstoniaEthiopiaEuro areaEurope & Central AsiaEurope & Central Asia (excluding high income)Europe & Central Asia (IDA & IBRD countries)European UnionFaroe IslandsFijiFinlandFranceFrench PolynesiaGabonGambia, TheGeorgiaGermanyGhanaGreeceGreenlandGrenadaGuatemalaGuineaGuinea-BissauGuyanaHaitiHeavily indebted poor countries (HIPC)High incomeHondurasHong Kong SAR, ChinaHungaryIBRD onlyIcelandIDA & IBRD totalIDA blendIDA onlyIDA totalIndiaIndonesiaIran, Islamic Rep.IraqIrelandIsraelItalyJamaicaJapanJordanKazakhstanKenyaKiribatiKorea, Rep.KuwaitKyrgyz RepublicLate-demographic dividendLatin America & Caribbean Latin America & Caribbean (excluding high income)Latin America & the Caribbean (IDA & IBRD countries)LatviaLebanonLesothoLithuaniaLow & middle incomeLow incomeLower middle incomeLuxembourgMacao SAR, ChinaMacedonia, FYRMadagascarMalawiMalaysiaMaldivesMaliMaltaMauritiusMexicoMiddle East & North AfricaMiddle East & North Africa (excluding high income)Middle East & North Africa (IDA & IBRD countries)Middle incomeMoldovaMongoliaMontenegroMoroccoMozambiqueMyanmarNamibiaNepalNetherlandsNew CaledoniaNew ZealandNicaraguaNigerNigeriaNorth AmericaNorwayOECD membersOmanOther small statesPakistanPalauPanamaPapua New GuineaParaguayPeruPhilippinesPolandPortugalPost-demographic dividendQatarRomaniaRussian FederationRwandaSamoaSao Tome and PrincipeSaudi ArabiaSenegalSerbiaSeychellesSierra LeoneSingaporeSlovak RepublicSloveniaSmall statesSolomon IslandsSouth AfricaSouth AsiaSouth Asia (IDA & IBRD)South SudanSpainSri LankaSt. Kitts and NevisSt. LuciaSt. Vincent and the GrenadinesSub-Saharan Africa Sub-Saharan Africa (excluding high income)Sub-Saharan Africa (IDA & IBRD countries)SudanSurinameSwazilandSwedenSwitzerlandSyrian Arab RepublicTajikistanTanzaniaThailandTimor-LesteTogoTongaTrinidad and TobagoTunisiaTurkeyTurkmenistanTurks and Caicos IslandsTuvaluUgandaUkraineUnited Arab EmiratesUnited KingdomUnited StatesUpper middle incomeUruguayVanuatuVenezuela, RBVietnamWest Bank and GazaWorldYemen, Rep.ZambiaZimbabwe Timeline:
This timeline shows a graph from 1989 to 2016 of Iceland. No data until 1988. Number of actual observations by date: 28.
Source name:
World Development Indicators
Source organization:
United Nations, Comtrade database.
Categories, topics:
Private Sector, Science & Technology, Trade
Last updated:
apr 23, 2017
Indicators value changes by year
Minimum:
1.847 mln
jan 1, 1992
Maximum:
774.359 mln
jan 1, 2008
At the date of observation
Value
Absolute change
Change from previous value
jan 1, 1989
50.934 mln
+50.934 mln
0.0%
jan 1, 1990
7.591 mln
-43.343 mln
-85.1%
jan 1, 1991
12.717 mln
+5.125 mln
67.52%
jan 1, 1992
1.847 mln
-10.87 mln
-85.48%
jan 1, 1993
3.513 mln
+1.666 mln
90.23%
jan 1, 1994
4.568 mln
+1.055 mln
30.04%
jan 1, 1995
31.697 mln
+27.129 mln
593.89%
jan 1, 1996
34.499 mln
+2.801 mln
8.84%
jan 1, 1997
43.445 mln
+8.946 mln
25.93%
jan 1, 1998
44.804 mln
+1.359 mln
3.13%
jan 1, 1999
36.248 mln
-8.555 mln
-19.1%
jan 1, 2000
41.797 mln
+5.548 mln
15.31%
jan 1, 2001
32.424 mln
-9.373 mln
-22.42%
jan 1, 2002
27.064 mln
-5.36 mln
-16.53%
jan 1, 2003
37.346 mln
+10.283 mln
37.99%
jan 1, 2004
47.248 mln
+9.902 mln
26.51%
jan 1, 2005
67.883 mln
+20.635 mln
43.67%
jan 1, 2006
202.602 mln
+134.718 mln
198.46%
jan 1, 2007
308.467 mln
+105.865 mln
52.25%
jan 1, 2008
774.359 mln
+465.892 mln
151.03%
jan 1, 2009
415.727 mln
-358.632 mln
-46.31%
jan 1, 2010
245.696 mln
-170.031 mln
-40.9%
jan 1, 2011
141.381 mln
-104.315 mln
-42.46%
jan 1, 2012
156.243 mln
+14.862 mln
10.51%
jan 1, 2013
103.588 mln
-52.654 mln
-33.7%
jan 1, 2014
93.401 mln
-10.187 mln
-9.83%
jan 1, 2015
118.379 mln
+24.977 mln
26.74%
jan 1, 2016
110.196 mln
-8.182 mln
-6.91%
Ranking of countries by current statistics by years


Comments: