29
/
en
AIzaSyAYiBZKx7MnpbEhh9jyipgxe19OcubqV5w
April 1, 2024
101176
Canada
CAN
true
2
1
High-technology exports (current US$)
2016,2015,2014,2013,2012,2011,2010,2009,2008,2007,2006,2005,2004,2003,2002,2001,2000,1999,1998,1997,1996,1995,1994,1993,1992,1991,1990,1989
This statistics in other country:
AlbaniaAlgeriaAndorraAntigua and BarbudaArab WorldArgentinaArmeniaArubaAustraliaAustriaAzerbaijanBahamas, TheBahrainBangladeshBarbadosBelarusBelgiumBelizeBeninBermudaBhutanBoliviaBosnia and HerzegovinaBotswanaBrazilBrunei DarussalamBulgariaBurkina FasoBurundiCabo VerdeCambodiaCameroonCanadaCaribbean small statesCentral African RepublicCentral Europe and the BalticsChileChinaColombiaComorosCongo, Rep.Costa RicaCote d'IvoireCroatiaCubaCyprusCzech RepublicDenmarkDjiboutiDominicaDominican RepublicEarly-demographic dividendEast Asia & PacificEcuadorEgypt, Arab Rep.El SalvadorEritreaEstoniaEthiopiaEuro areaEurope & Central AsiaEurope & Central Asia (excluding high income)Europe & Central Asia (IDA & IBRD countries)European UnionFaroe IslandsFijiFinlandFranceFrench PolynesiaGabonGambia, TheGeorgiaGermanyGhanaGreeceGreenlandGrenadaGuatemalaGuineaGuinea-BissauGuyanaHaitiHeavily indebted poor countries (HIPC)High incomeHondurasHong Kong SAR, ChinaHungaryIBRD onlyIcelandIDA & IBRD totalIDA blendIDA onlyIDA totalIndiaIndonesiaIran, Islamic Rep.IraqIrelandIsraelItalyJamaicaJapanJordanKazakhstanKenyaKiribatiKorea, Rep.KuwaitKyrgyz RepublicLate-demographic dividendLatin America & Caribbean Latin America & Caribbean (excluding high income)Latin America & the Caribbean (IDA & IBRD countries)LatviaLebanonLesothoLithuaniaLow & middle incomeLow incomeLower middle incomeLuxembourgMacao SAR, ChinaMacedonia, FYRMadagascarMalawiMalaysiaMaldivesMaliMaltaMauritiusMexicoMiddle East & North AfricaMiddle East & North Africa (excluding high income)Middle East & North Africa (IDA & IBRD countries)Middle incomeMoldovaMongoliaMontenegroMoroccoMozambiqueMyanmarNamibiaNepalNetherlandsNew CaledoniaNew ZealandNicaraguaNigerNigeriaNorth AmericaNorwayOECD membersOmanOther small statesPakistanPalauPanamaPapua New GuineaParaguayPeruPhilippinesPolandPortugalPost-demographic dividendQatarRomaniaRussian FederationRwandaSamoaSao Tome and PrincipeSaudi ArabiaSenegalSerbiaSeychellesSierra LeoneSingaporeSlovak RepublicSloveniaSmall statesSolomon IslandsSouth AfricaSouth AsiaSouth Asia (IDA & IBRD)South SudanSpainSri LankaSt. Kitts and NevisSt. LuciaSt. Vincent and the GrenadinesSub-Saharan Africa Sub-Saharan Africa (excluding high income)Sub-Saharan Africa (IDA & IBRD countries)SudanSurinameSwazilandSwedenSwitzerlandSyrian Arab RepublicTajikistanTanzaniaThailandTimor-LesteTogoTongaTrinidad and TobagoTunisiaTurkeyTurkmenistanTurks and Caicos IslandsTuvaluUgandaUkraineUnited Arab EmiratesUnited KingdomUnited StatesUpper middle incomeUruguayVanuatuVenezuela, RBVietnamWest Bank and GazaWorldYemen, Rep.ZambiaZimbabwe Timeline:
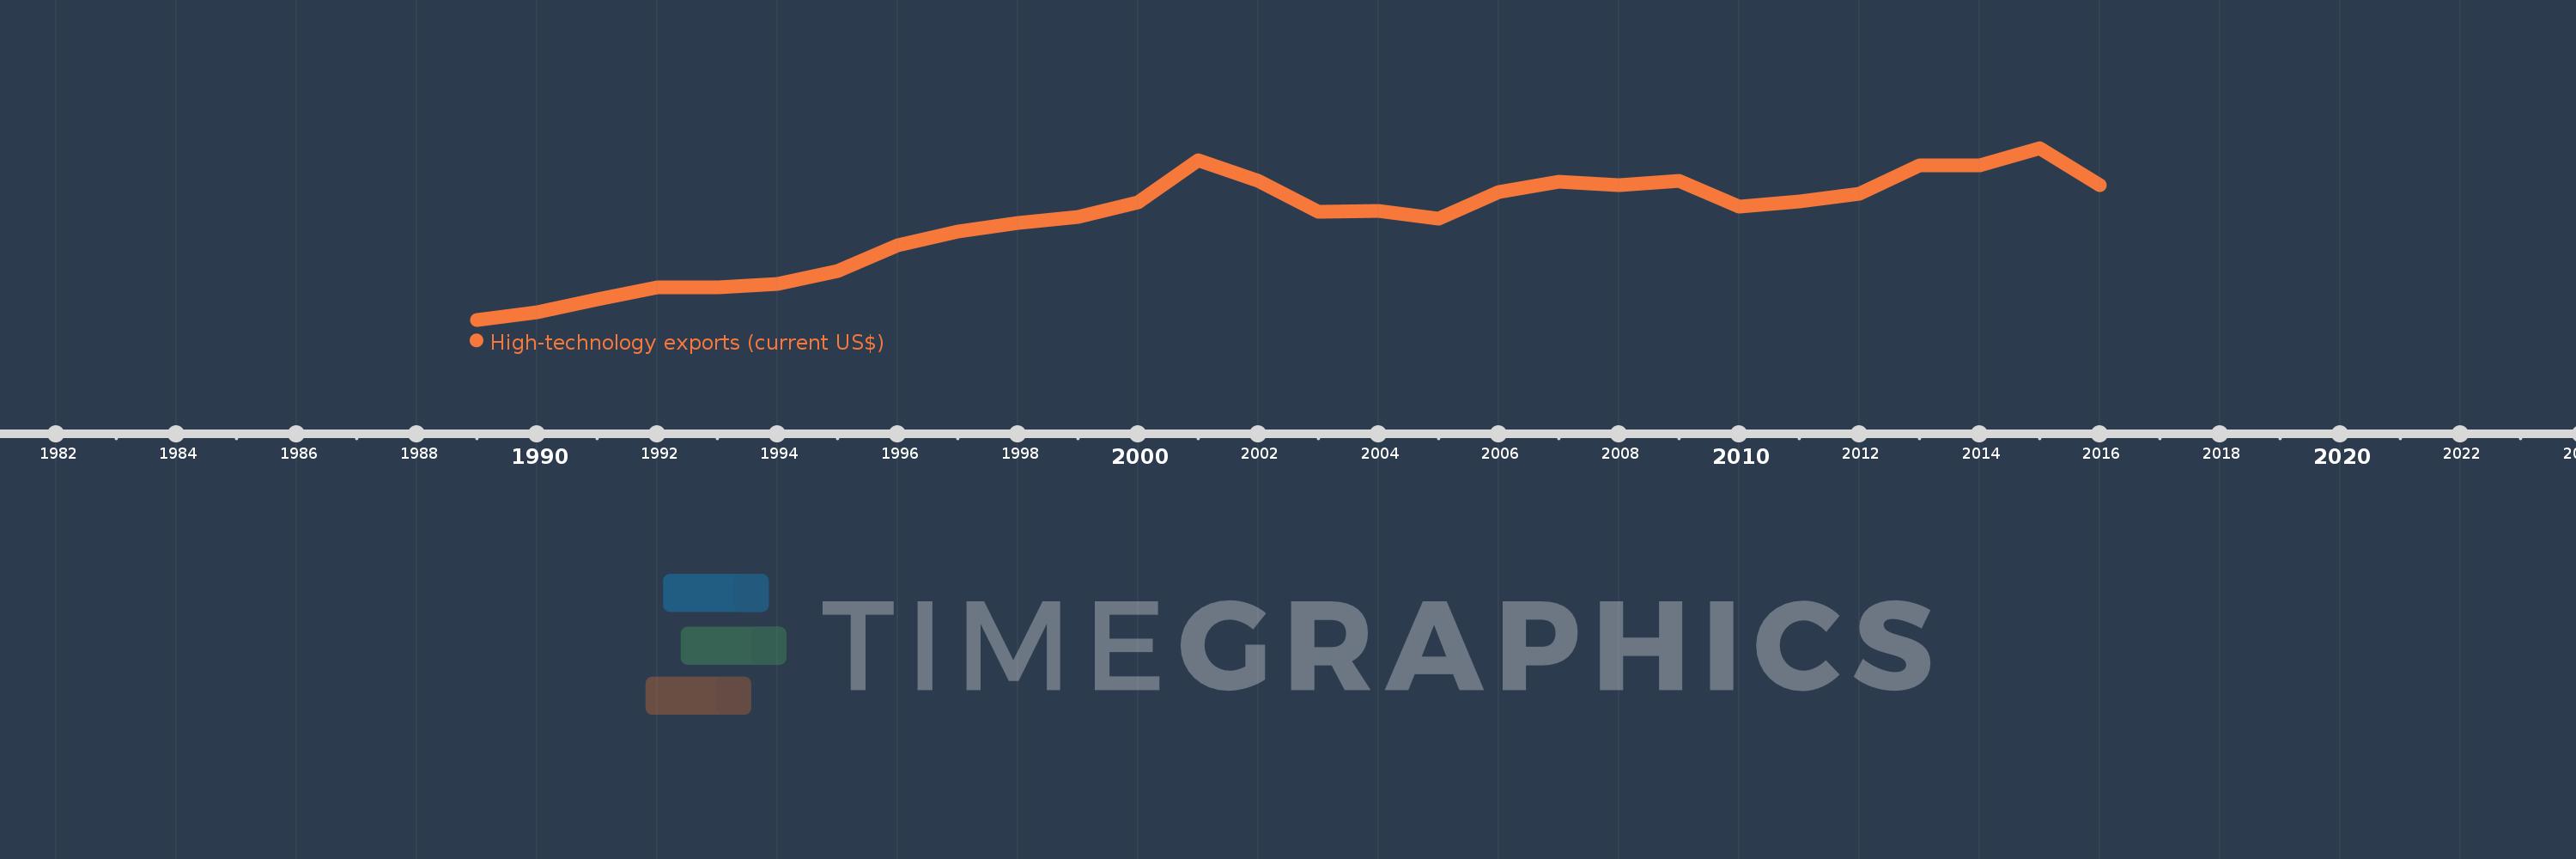
This timeline shows a graph from 1989 to 2016 of Canada. No data until 1988. Number of actual observations by date: 28.
Source name:
World Development Indicators
Source organization:
United Nations, Comtrade database.
Categories, topics:
Private Sector, Science & Technology, Trade
Last updated:
apr 23, 2017
Indicators value changes by year
Minimum:
7.261 bln
jan 1, 1989
Maximum:
31.535 bln
jan 1, 2015
At the date of observation
Value
Absolute change
Change from previous value
jan 1, 1989
7.261 bln
+7.261 bln
0.0%
jan 1, 1990
8.344 bln
+1.082 bln
14.91%
jan 1, 1991
10.122 bln
+1.778 bln
21.31%
jan 1, 1992
11.804 bln
+1.682 bln
16.62%
jan 1, 1993
11.783 bln
-21.607 mln
-0.18%
jan 1, 1994
12.305 bln
+522.116 mln
4.43%
jan 1, 1995
14.171 bln
+1.866 bln
15.17%
jan 1, 1996
17.738 bln
+3.567 bln
25.17%
jan 1, 1997
19.77 bln
+2.032 bln
11.46%
jan 1, 1998
20.981 bln
+1.211 bln
6.12%
jan 1, 1999
21.838 bln
+856.419 mln
4.08%
jan 1, 2000
23.793 bln
+1.955 bln
8.95%
jan 1, 2001
29.78 bln
+5.987 bln
25.16%
jan 1, 2002
26.883 bln
-2.897 bln
-9.73%
jan 1, 2003
22.537 bln
-4.346 bln
-16.17%
jan 1, 2004
22.652 bln
+114.792 mln
0.51%
jan 1, 2005
21.526 bln
-1.126 bln
-4.97%
jan 1, 2006
25.352 bln
+3.826 bln
17.77%
jan 1, 2007
26.735 bln
+1.383 bln
5.46%
jan 1, 2008
26.311 bln
-424.471 mln
-1.59%
jan 1, 2009
26.911 bln
+600.869 mln
2.28%
jan 1, 2010
23.21 bln
-3.701 bln
-13.75%
jan 1, 2011
23.963 bln
+753.224 mln
3.25%
jan 1, 2012
25.017 bln
+1.054 bln
4.4%
jan 1, 2013
29.087 bln
+4.07 bln
16.27%
jan 1, 2014
29.026 bln
-61.273 mln
-0.21%
jan 1, 2015
31.535 bln
+2.509 bln
8.64%
jan 1, 2016
26.295 bln
-5.24 bln
-16.62%
Ranking of countries by current statistics by years


Comments: