29
/
en
AIzaSyAYiBZKx7MnpbEhh9jyipgxe19OcubqV5w
April 1, 2024
134198
France
FRA
true
2
1
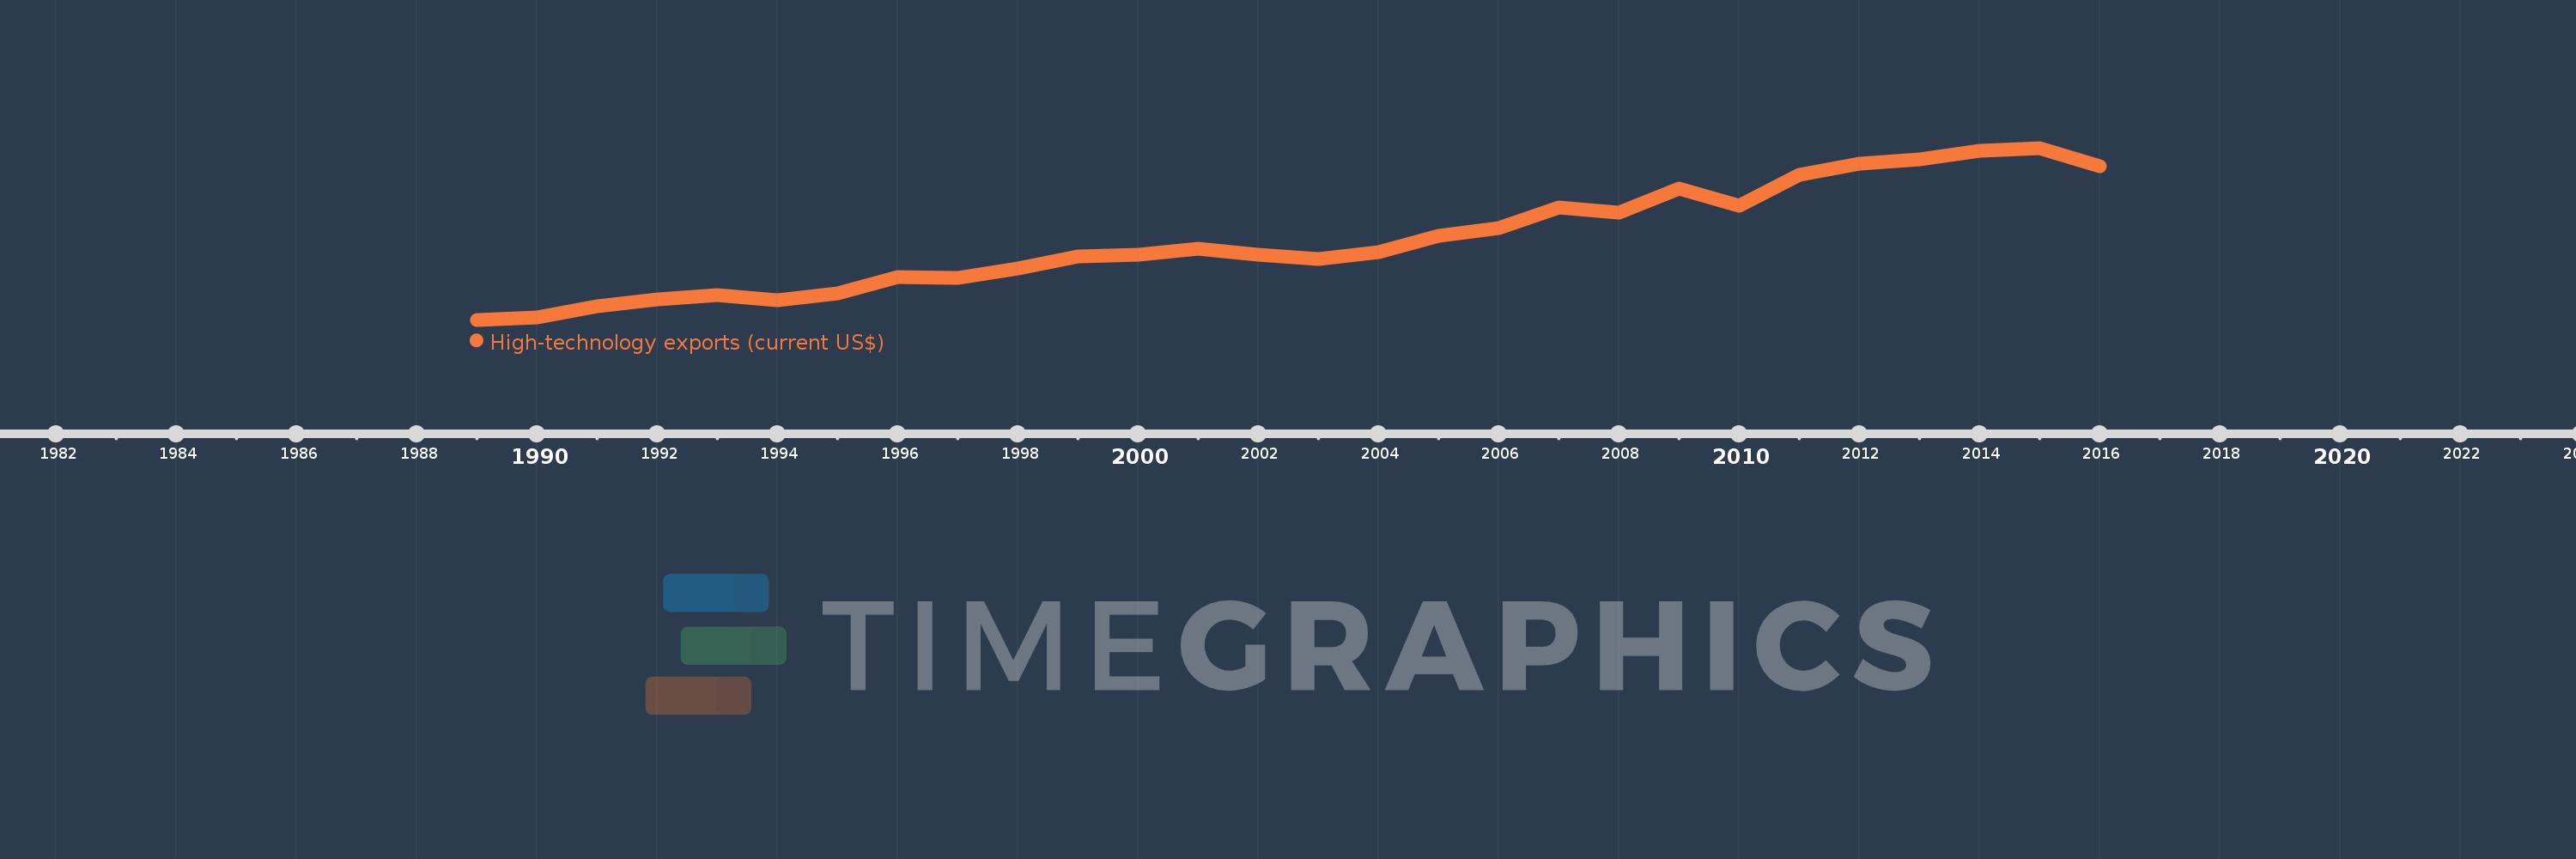
High-technology exports (current US$)
2016,2015,2014,2013,2012,2011,2010,2009,2008,2007,2006,2005,2004,2003,2002,2001,2000,1999,1998,1997,1996,1995,1994,1993,1992,1991,1990,1989
This statistics in other country:
AlbaniaAlgeriaAndorraAntigua and BarbudaArab WorldArgentinaArmeniaArubaAustraliaAustriaAzerbaijanBahamas, TheBahrainBangladeshBarbadosBelarusBelgiumBelizeBeninBermudaBhutanBoliviaBosnia and HerzegovinaBotswanaBrazilBrunei DarussalamBulgariaBurkina FasoBurundiCabo VerdeCambodiaCameroonCanadaCaribbean small statesCentral African RepublicCentral Europe and the BalticsChileChinaColombiaComorosCongo, Rep.Costa RicaCote d'IvoireCroatiaCubaCyprusCzech RepublicDenmarkDjiboutiDominicaDominican RepublicEarly-demographic dividendEast Asia & PacificEcuadorEgypt, Arab Rep.El SalvadorEritreaEstoniaEthiopiaEuro areaEurope & Central AsiaEurope & Central Asia (excluding high income)Europe & Central Asia (IDA & IBRD countries)European UnionFaroe IslandsFijiFinlandFranceFrench PolynesiaGabonGambia, TheGeorgiaGermanyGhanaGreeceGreenlandGrenadaGuatemalaGuineaGuinea-BissauGuyanaHaitiHeavily indebted poor countries (HIPC)High incomeHondurasHong Kong SAR, ChinaHungaryIBRD onlyIcelandIDA & IBRD totalIDA blendIDA onlyIDA totalIndiaIndonesiaIran, Islamic Rep.IraqIrelandIsraelItalyJamaicaJapanJordanKazakhstanKenyaKiribatiKorea, Rep.KuwaitKyrgyz RepublicLate-demographic dividendLatin America & Caribbean Latin America & Caribbean (excluding high income)Latin America & the Caribbean (IDA & IBRD countries)LatviaLebanonLesothoLithuaniaLow & middle incomeLow incomeLower middle incomeLuxembourgMacao SAR, ChinaMacedonia, FYRMadagascarMalawiMalaysiaMaldivesMaliMaltaMauritiusMexicoMiddle East & North AfricaMiddle East & North Africa (excluding high income)Middle East & North Africa (IDA & IBRD countries)Middle incomeMoldovaMongoliaMontenegroMoroccoMozambiqueMyanmarNamibiaNepalNetherlandsNew CaledoniaNew ZealandNicaraguaNigerNigeriaNorth AmericaNorwayOECD membersOmanOther small statesPakistanPalauPanamaPapua New GuineaParaguayPeruPhilippinesPolandPortugalPost-demographic dividendQatarRomaniaRussian FederationRwandaSamoaSao Tome and PrincipeSaudi ArabiaSenegalSerbiaSeychellesSierra LeoneSingaporeSlovak RepublicSloveniaSmall statesSolomon IslandsSouth AfricaSouth AsiaSouth Asia (IDA & IBRD)South SudanSpainSri LankaSt. Kitts and NevisSt. LuciaSt. Vincent and the GrenadinesSub-Saharan Africa Sub-Saharan Africa (excluding high income)Sub-Saharan Africa (IDA & IBRD countries)SudanSurinameSwazilandSwedenSwitzerlandSyrian Arab RepublicTajikistanTanzaniaThailandTimor-LesteTogoTongaTrinidad and TobagoTunisiaTurkeyTurkmenistanTurks and Caicos IslandsTuvaluUgandaUkraineUnited Arab EmiratesUnited KingdomUnited StatesUpper middle incomeUruguayVanuatuVenezuela, RBVietnamWest Bank and GazaWorldYemen, Rep.ZambiaZimbabwe Timeline:
This timeline shows a graph from 1989 to 2016 of France. No data until 1988. Number of actual observations by date: 28.
Source name:
World Development Indicators
Source organization:
United Nations, Comtrade database.
Categories, topics:
Private Sector, Science & Technology, Trade
Last updated:
apr 23, 2017
Indicators value changes by year
Minimum:
19.574 bln
jan 1, 1989
Maximum:
114.697 bln
jan 1, 2015
At the date of observation
Value
Absolute change
Change from previous value
jan 1, 1989
19.574 bln
+19.574 bln
0.0%
jan 1, 1990
20.921 bln
+1.347 bln
6.88%
jan 1, 1991
26.914 bln
+5.993 bln
28.65%
jan 1, 1992
30.979 bln
+4.065 bln
15.1%
jan 1, 1993
33.339 bln
+2.36 bln
7.62%
jan 1, 1994
30.538 bln
-2.801 bln
-8.4%
jan 1, 1995
34.222 bln
+3.683 bln
12.06%
jan 1, 1996
43.019 bln
+8.797 bln
25.71%
jan 1, 1997
42.649 bln
-369.733 mln
-0.86%
jan 1, 1998
48.094 bln
+5.444 bln
12.77%
jan 1, 1999
54.665 bln
+6.571 bln
13.66%
jan 1, 2000
55.59 bln
+925.7 mln
1.69%
jan 1, 2001
58.765 bln
+3.175 bln
5.71%
jan 1, 2002
55.54 bln
-3.225 bln
-5.49%
jan 1, 2003
53.277 bln
-2.263 bln
-4.07%
jan 1, 2004
57.053 bln
+3.776 bln
7.09%
jan 1, 2005
66.065 bln
+9.013 bln
15.8%
jan 1, 2006
70.506 bln
+4.44 bln
6.72%
jan 1, 2007
81.538 bln
+11.032 bln
15.65%
jan 1, 2008
78.822 bln
-2.716 bln
-3.33%
jan 1, 2009
91.98 bln
+13.159 bln
16.69%
jan 1, 2010
82.531 bln
-9.449 bln
-10.27%
jan 1, 2011
99.736 bln
+17.205 bln
20.85%
jan 1, 2012
105.761 bln
+6.026 bln
6.04%
jan 1, 2013
108.586 bln
+2.824 bln
2.67%
jan 1, 2014
113.251 bln
+4.665 bln
4.3%
jan 1, 2015
114.697 bln
+1.447 bln
1.28%
jan 1, 2016
104.34 bln
-10.357 bln
-9.03%
Ranking of countries by current statistics by years


Comments: