29
/
en
AIzaSyAYiBZKx7MnpbEhh9jyipgxe19OcubqV5w
April 1, 2024
52674
OECD members
OED
false
2
1
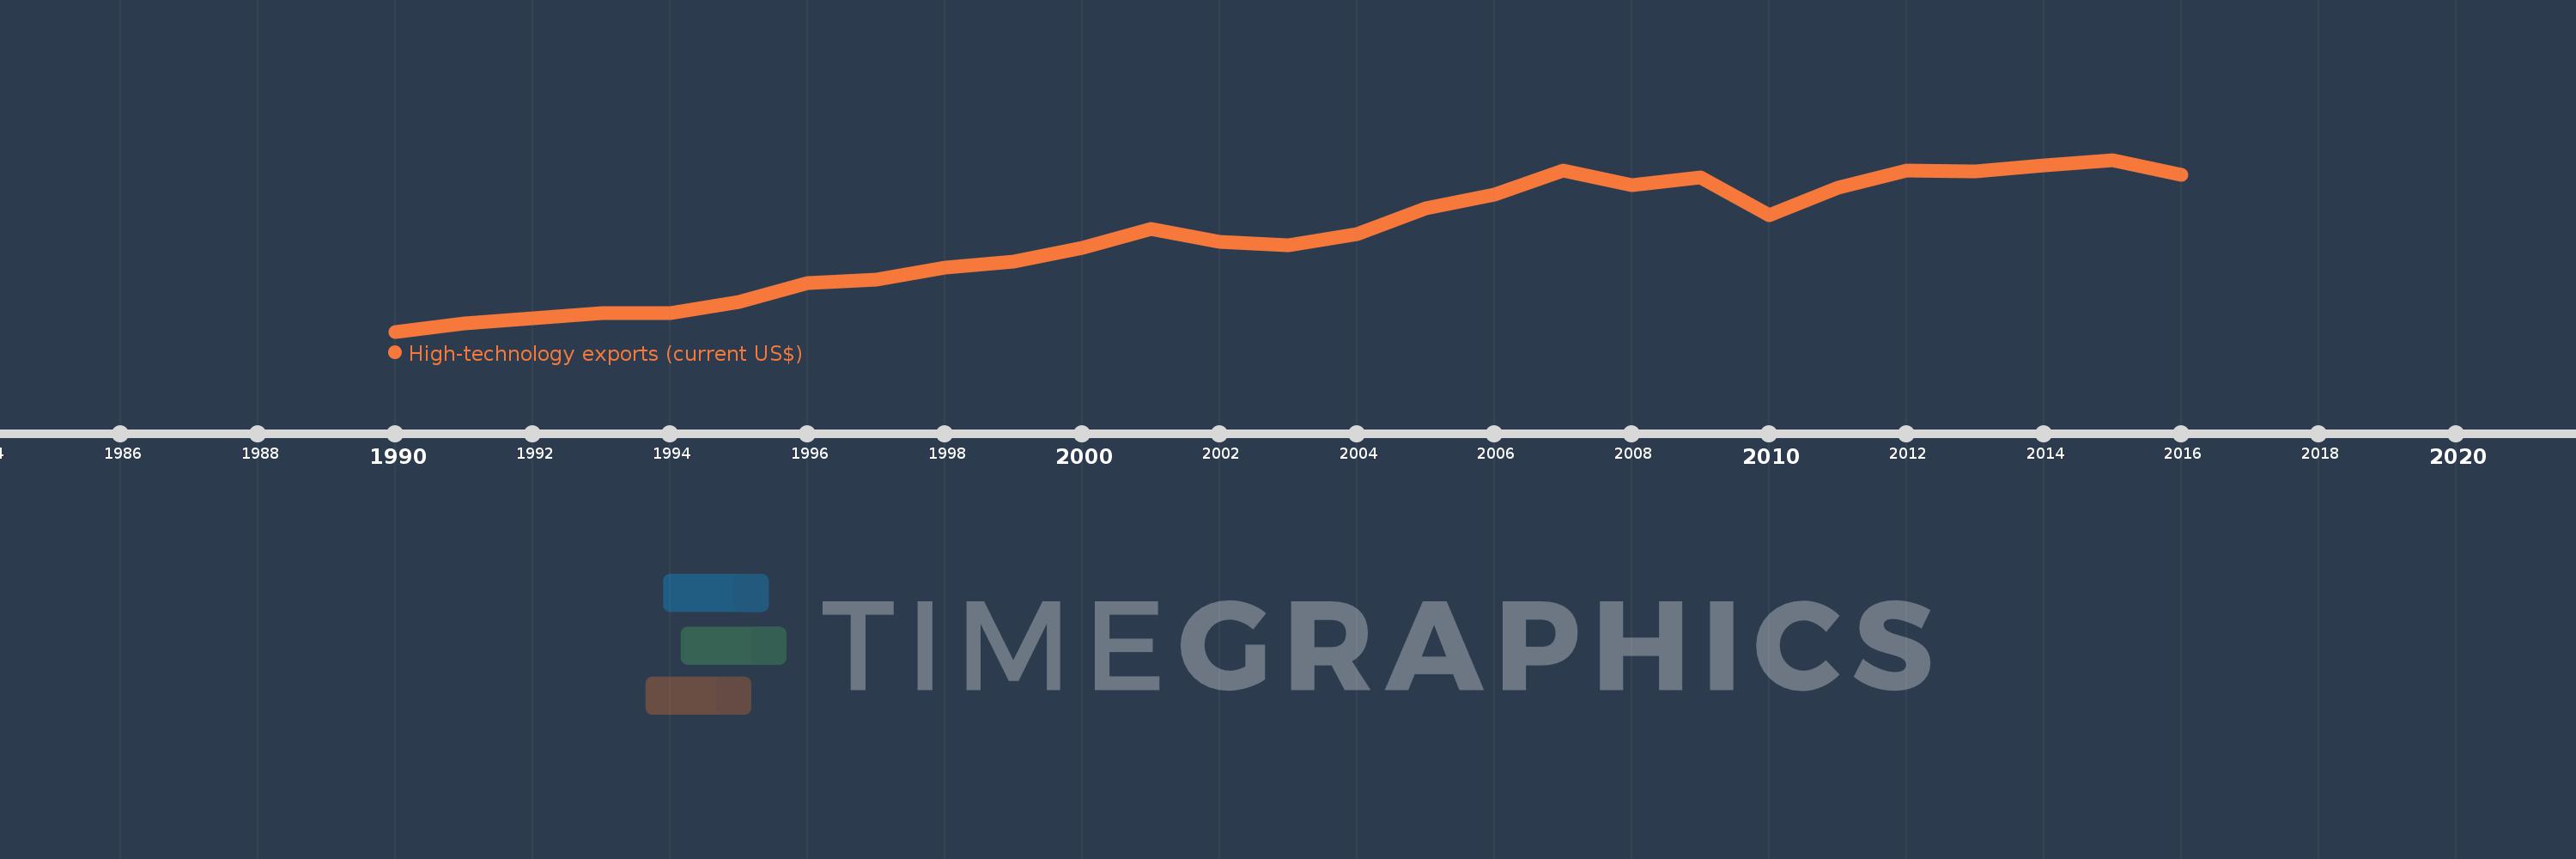
High-technology exports (current US$)
2016,2015,2014,2013,2012,2011,2010,2009,2008,2007,2006,2005,2004,2003,2002,2001,2000,1999,1998,1997,1996,1995,1994,1993,1992,1991,1990
This statistics in other country:
AlbaniaAlgeriaAndorraAntigua and BarbudaArab WorldArgentinaArmeniaArubaAustraliaAustriaAzerbaijanBahamas, TheBahrainBangladeshBarbadosBelarusBelgiumBelizeBeninBermudaBhutanBoliviaBosnia and HerzegovinaBotswanaBrazilBrunei DarussalamBulgariaBurkina FasoBurundiCabo VerdeCambodiaCameroonCanadaCaribbean small statesCentral African RepublicCentral Europe and the BalticsChileChinaColombiaComorosCongo, Rep.Costa RicaCote d'IvoireCroatiaCubaCyprusCzech RepublicDenmarkDjiboutiDominicaDominican RepublicEarly-demographic dividendEast Asia & PacificEcuadorEgypt, Arab Rep.El SalvadorEritreaEstoniaEthiopiaEuro areaEurope & Central AsiaEurope & Central Asia (excluding high income)Europe & Central Asia (IDA & IBRD countries)European UnionFaroe IslandsFijiFinlandFranceFrench PolynesiaGabonGambia, TheGeorgiaGermanyGhanaGreeceGreenlandGrenadaGuatemalaGuineaGuinea-BissauGuyanaHaitiHeavily indebted poor countries (HIPC)High incomeHondurasHong Kong SAR, ChinaHungaryIBRD onlyIcelandIDA & IBRD totalIDA blendIDA onlyIDA totalIndiaIndonesiaIran, Islamic Rep.IraqIrelandIsraelItalyJamaicaJapanJordanKazakhstanKenyaKiribatiKorea, Rep.KuwaitKyrgyz RepublicLate-demographic dividendLatin America & Caribbean Latin America & Caribbean (excluding high income)Latin America & the Caribbean (IDA & IBRD countries)LatviaLebanonLesothoLithuaniaLow & middle incomeLow incomeLower middle incomeLuxembourgMacao SAR, ChinaMacedonia, FYRMadagascarMalawiMalaysiaMaldivesMaliMaltaMauritiusMexicoMiddle East & North AfricaMiddle East & North Africa (excluding high income)Middle East & North Africa (IDA & IBRD countries)Middle incomeMoldovaMongoliaMontenegroMoroccoMozambiqueMyanmarNamibiaNepalNetherlandsNew CaledoniaNew ZealandNicaraguaNigerNigeriaNorth AmericaNorwayOECD membersOmanOther small statesPakistanPalauPanamaPapua New GuineaParaguayPeruPhilippinesPolandPortugalPost-demographic dividendQatarRomaniaRussian FederationRwandaSamoaSao Tome and PrincipeSaudi ArabiaSenegalSerbiaSeychellesSierra LeoneSingaporeSlovak RepublicSloveniaSmall statesSolomon IslandsSouth AfricaSouth AsiaSouth Asia (IDA & IBRD)South SudanSpainSri LankaSt. Kitts and NevisSt. LuciaSt. Vincent and the GrenadinesSub-Saharan Africa Sub-Saharan Africa (excluding high income)Sub-Saharan Africa (IDA & IBRD countries)SudanSurinameSwazilandSwedenSwitzerlandSyrian Arab RepublicTajikistanTanzaniaThailandTimor-LesteTogoTongaTrinidad and TobagoTunisiaTurkeyTurkmenistanTurks and Caicos IslandsTuvaluUgandaUkraineUnited Arab EmiratesUnited KingdomUnited StatesUpper middle incomeUruguayVanuatuVenezuela, RBVietnamWest Bank and GazaWorldYemen, Rep.ZambiaZimbabwe Timeline:
This timeline shows a graph from 1990 to 2016 of OECD members. No data until 1989. Number of actual observations by date: 27.
Source name:
World Development Indicators
Source organization:
United Nations, Comtrade database.
Categories, topics:
Private Sector, Science & Technology, Trade
Last updated:
apr 23, 2017
Indicators value changes by year
Minimum:
299.559 bln
jan 1, 1990
Maximum:
1.233 trl
jan 1, 2015
At the date of observation
Value
Absolute change
Change from previous value
jan 1, 1990
299.559 bln
+299.559 bln
0.0%
jan 1, 1991
343.422 bln
+43.863 bln
14.64%
jan 1, 1992
371.456 bln
+28.035 bln
8.16%
jan 1, 1993
399.419 bln
+27.962 bln
7.53%
jan 1, 1994
402.211 bln
+2.792 bln
0.7%
jan 1, 1995
462.412 bln
+60.201 bln
14.97%
jan 1, 1996
561.354 bln
+98.942 bln
21.4%
jan 1, 1997
581.026 bln
+19.672 bln
3.5%
jan 1, 1998
646.485 bln
+65.46 bln
11.27%
jan 1, 1999
678.968 bln
+32.483 bln
5.02%
jan 1, 2000
752.552 bln
+73.584 bln
10.84%
jan 1, 2001
858.968 bln
+106.416 bln
14.14%
jan 1, 2002
785.674 bln
-73.294 bln
-8.53%
jan 1, 2003
770.619 bln
-15.054 bln
-1.92%
jan 1, 2004
830.21 bln
+59.591 bln
7.73%
jan 1, 2005
970.244 bln
+140.034 bln
16.87%
jan 1, 2006
1.045 trl
+74.974 bln
7.73%
jan 1, 2007
1.173 trl
+127.943 bln
12.24%
jan 1, 2008
1.096 trl
-76.782 bln
-6.54%
jan 1, 2009
1.139 trl
+42.259 bln
3.85%
jan 1, 2010
929.594 bln
-209.044 bln
-18.36%
jan 1, 2011
1.079 trl
+149.532 bln
16.09%
jan 1, 2012
1.174 trl
+95.028 bln
8.81%
jan 1, 2013
1.171 trl
-3.011 bln
-0.26%
jan 1, 2014
1.2 trl
+29.148 bln
2.49%
jan 1, 2015
1.233 trl
+32.598 bln
2.72%
jan 1, 2016
1.154 trl
-79.369 bln
-6.44%
Ranking of countries by current statistics by years


Comments: