29
/
en
AIzaSyAYiBZKx7MnpbEhh9jyipgxe19OcubqV5w
April 1, 2024
51917
North America
NAC
false
2
1
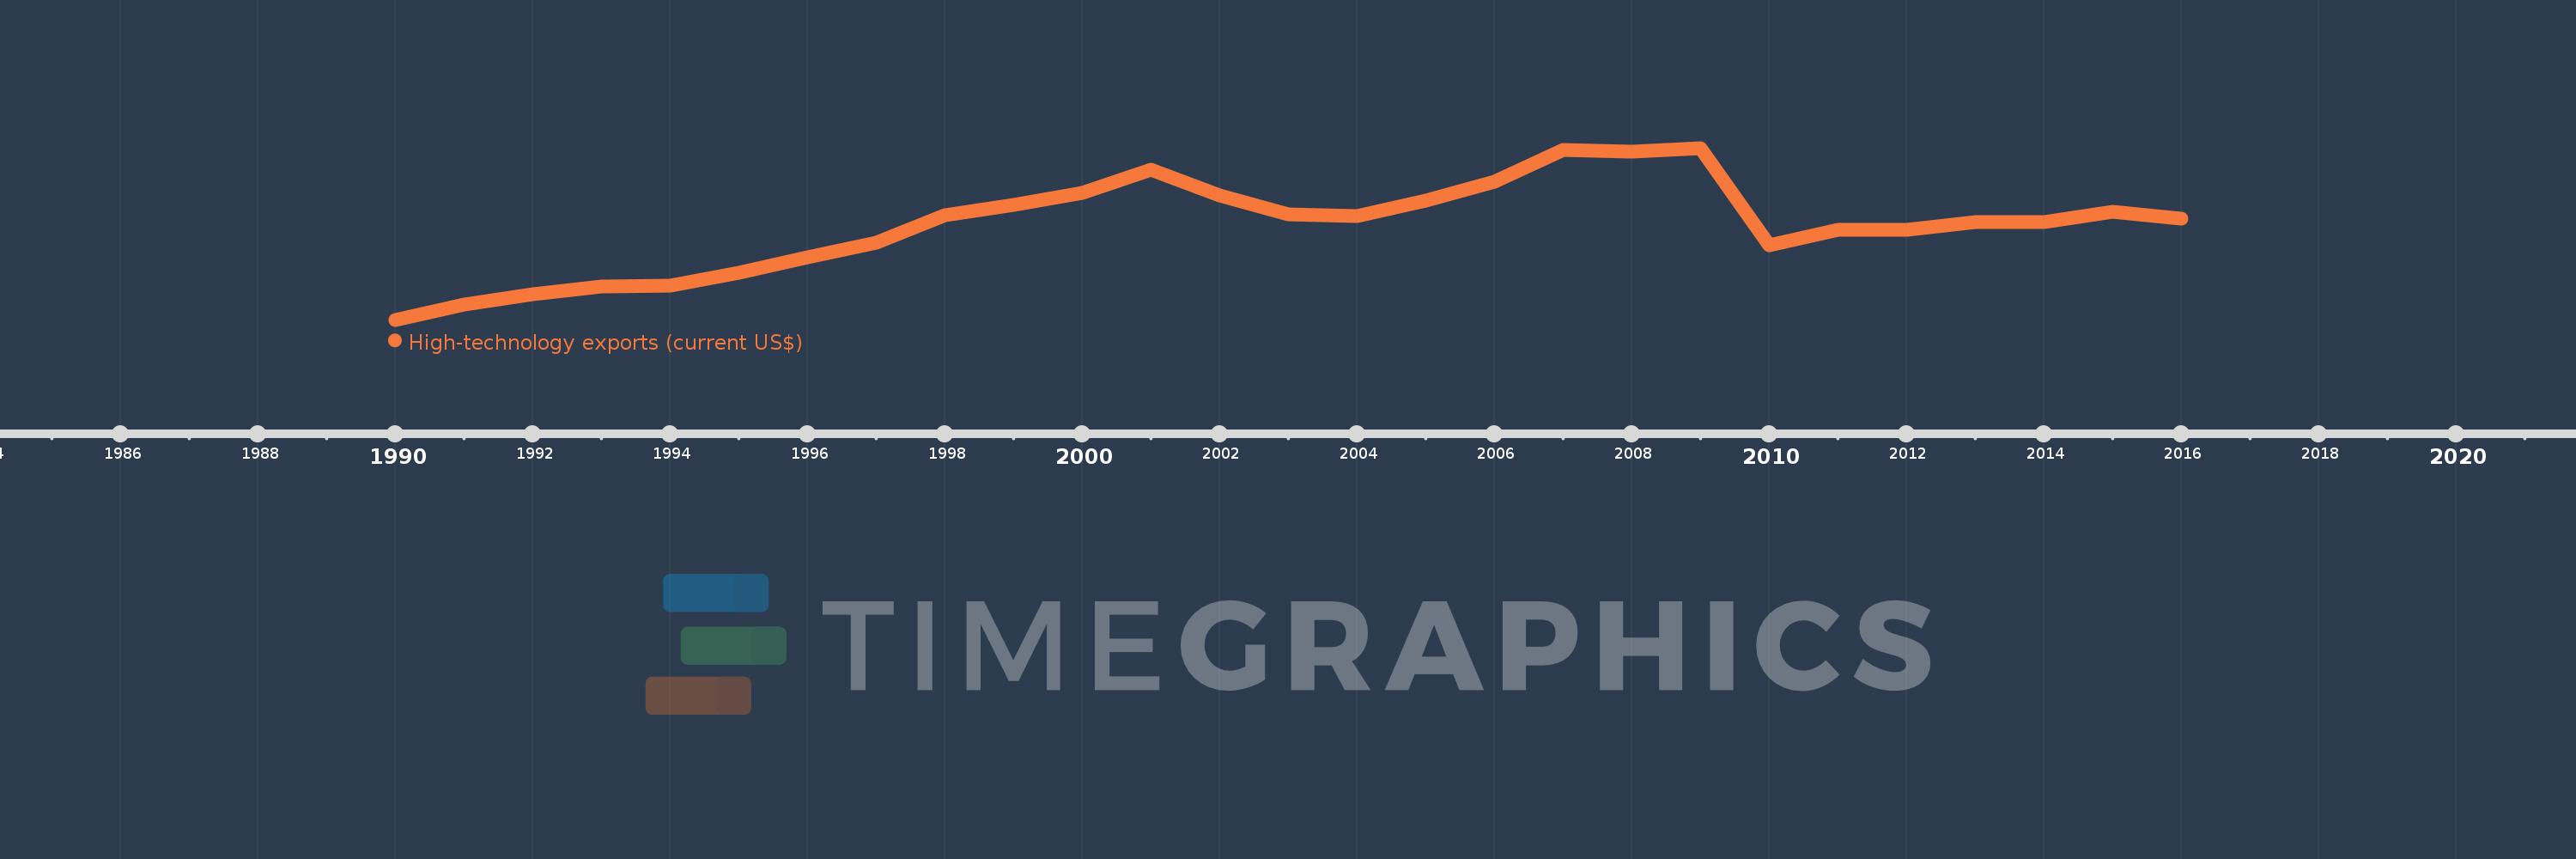
High-technology exports (current US$)
2016,2015,2014,2013,2012,2011,2010,2009,2008,2007,2006,2005,2004,2003,2002,2001,2000,1999,1998,1997,1996,1995,1994,1993,1992,1991,1990
This statistics in other country:
AlbaniaAlgeriaAndorraAntigua and BarbudaArab WorldArgentinaArmeniaArubaAustraliaAustriaAzerbaijanBahamas, TheBahrainBangladeshBarbadosBelarusBelgiumBelizeBeninBermudaBhutanBoliviaBosnia and HerzegovinaBotswanaBrazilBrunei DarussalamBulgariaBurkina FasoBurundiCabo VerdeCambodiaCameroonCanadaCaribbean small statesCentral African RepublicCentral Europe and the BalticsChileChinaColombiaComorosCongo, Rep.Costa RicaCote d'IvoireCroatiaCubaCyprusCzech RepublicDenmarkDjiboutiDominicaDominican RepublicEarly-demographic dividendEast Asia & PacificEcuadorEgypt, Arab Rep.El SalvadorEritreaEstoniaEthiopiaEuro areaEurope & Central AsiaEurope & Central Asia (excluding high income)Europe & Central Asia (IDA & IBRD countries)European UnionFaroe IslandsFijiFinlandFranceFrench PolynesiaGabonGambia, TheGeorgiaGermanyGhanaGreeceGreenlandGrenadaGuatemalaGuineaGuinea-BissauGuyanaHaitiHeavily indebted poor countries (HIPC)High incomeHondurasHong Kong SAR, ChinaHungaryIBRD onlyIcelandIDA & IBRD totalIDA blendIDA onlyIDA totalIndiaIndonesiaIran, Islamic Rep.IraqIrelandIsraelItalyJamaicaJapanJordanKazakhstanKenyaKiribatiKorea, Rep.KuwaitKyrgyz RepublicLate-demographic dividendLatin America & Caribbean Latin America & Caribbean (excluding high income)Latin America & the Caribbean (IDA & IBRD countries)LatviaLebanonLesothoLithuaniaLow & middle incomeLow incomeLower middle incomeLuxembourgMacao SAR, ChinaMacedonia, FYRMadagascarMalawiMalaysiaMaldivesMaliMaltaMauritiusMexicoMiddle East & North AfricaMiddle East & North Africa (excluding high income)Middle East & North Africa (IDA & IBRD countries)Middle incomeMoldovaMongoliaMontenegroMoroccoMozambiqueMyanmarNamibiaNepalNetherlandsNew CaledoniaNew ZealandNicaraguaNigerNigeriaNorth AmericaNorwayOECD membersOmanOther small statesPakistanPalauPanamaPapua New GuineaParaguayPeruPhilippinesPolandPortugalPost-demographic dividendQatarRomaniaRussian FederationRwandaSamoaSao Tome and PrincipeSaudi ArabiaSenegalSerbiaSeychellesSierra LeoneSingaporeSlovak RepublicSloveniaSmall statesSolomon IslandsSouth AfricaSouth AsiaSouth Asia (IDA & IBRD)South SudanSpainSri LankaSt. Kitts and NevisSt. LuciaSt. Vincent and the GrenadinesSub-Saharan Africa Sub-Saharan Africa (excluding high income)Sub-Saharan Africa (IDA & IBRD countries)SudanSurinameSwazilandSwedenSwitzerlandSyrian Arab RepublicTajikistanTanzaniaThailandTimor-LesteTogoTongaTrinidad and TobagoTunisiaTurkeyTurkmenistanTurks and Caicos IslandsTuvaluUgandaUkraineUnited Arab EmiratesUnited KingdomUnited StatesUpper middle incomeUruguayVanuatuVenezuela, RBVietnamWest Bank and GazaWorldYemen, Rep.ZambiaZimbabwe Timeline:
This timeline shows a graph from 1990 to 2016 of North America. No data until 1989. Number of actual observations by date: 27.
Source name:
World Development Indicators
Source organization:
United Nations, Comtrade database.
Categories, topics:
Private Sector, Science & Technology, Trade
Last updated:
apr 23, 2017
Indicators value changes by year
Minimum:
85.112 bln
jan 1, 1990
Maximum:
247.796 bln
jan 1, 2009
At the date of observation
Value
Absolute change
Change from previous value
jan 1, 1990
85.112 bln
+85.112 bln
0.0%
jan 1, 1991
99.639 bln
+14.527 bln
17.07%
jan 1, 1992
109.611 bln
+9.972 bln
10.01%
jan 1, 1993
116.484 bln
+6.872 bln
6.27%
jan 1, 1994
117.49 bln
+1.006 bln
0.86%
jan 1, 1995
129.706 bln
+12.217 bln
10.4%
jan 1, 1996
144.497 bln
+14.791 bln
11.4%
jan 1, 1997
157.864 bln
+13.367 bln
9.25%
jan 1, 1998
184.389 bln
+26.525 bln
16.8%
jan 1, 1999
193.807 bln
+9.418 bln
5.11%
jan 1, 2000
205.225 bln
+11.418 bln
5.89%
jan 1, 2001
227.246 bln
+22.021 bln
10.73%
jan 1, 2002
203.047 bln
-24.199 bln
-10.65%
jan 1, 2003
184.619 bln
-18.428 bln
-9.08%
jan 1, 2004
182.943 bln
-1.676 bln
-0.91%
jan 1, 2005
197.808 bln
+14.865 bln
8.13%
jan 1, 2006
216.089 bln
+18.281 bln
9.24%
jan 1, 2007
245.761 bln
+29.672 bln
13.73%
jan 1, 2008
244.426 bln
-1.335 bln
-0.54%
jan 1, 2009
247.796 bln
+3.37 bln
1.38%
jan 1, 2010
155.617 bln
-92.179 bln
-37.2%
jan 1, 2011
169.896 bln
+14.279 bln
9.18%
jan 1, 2012
170.656 bln
+759.476 mln
0.45%
jan 1, 2013
177.419 bln
+6.763 bln
3.96%
jan 1, 2014
177.559 bln
+140.428 mln
0.08%
jan 1, 2015
187.178 bln
+9.619 bln
5.42%
jan 1, 2016
180.65 bln
-6.528 bln
-3.49%
Ranking of countries by current statistics by years


Comments: