29
/
en
AIzaSyAYiBZKx7MnpbEhh9jyipgxe19OcubqV5w
April 1, 2024
225991
Portugal
PRT
true
2
1
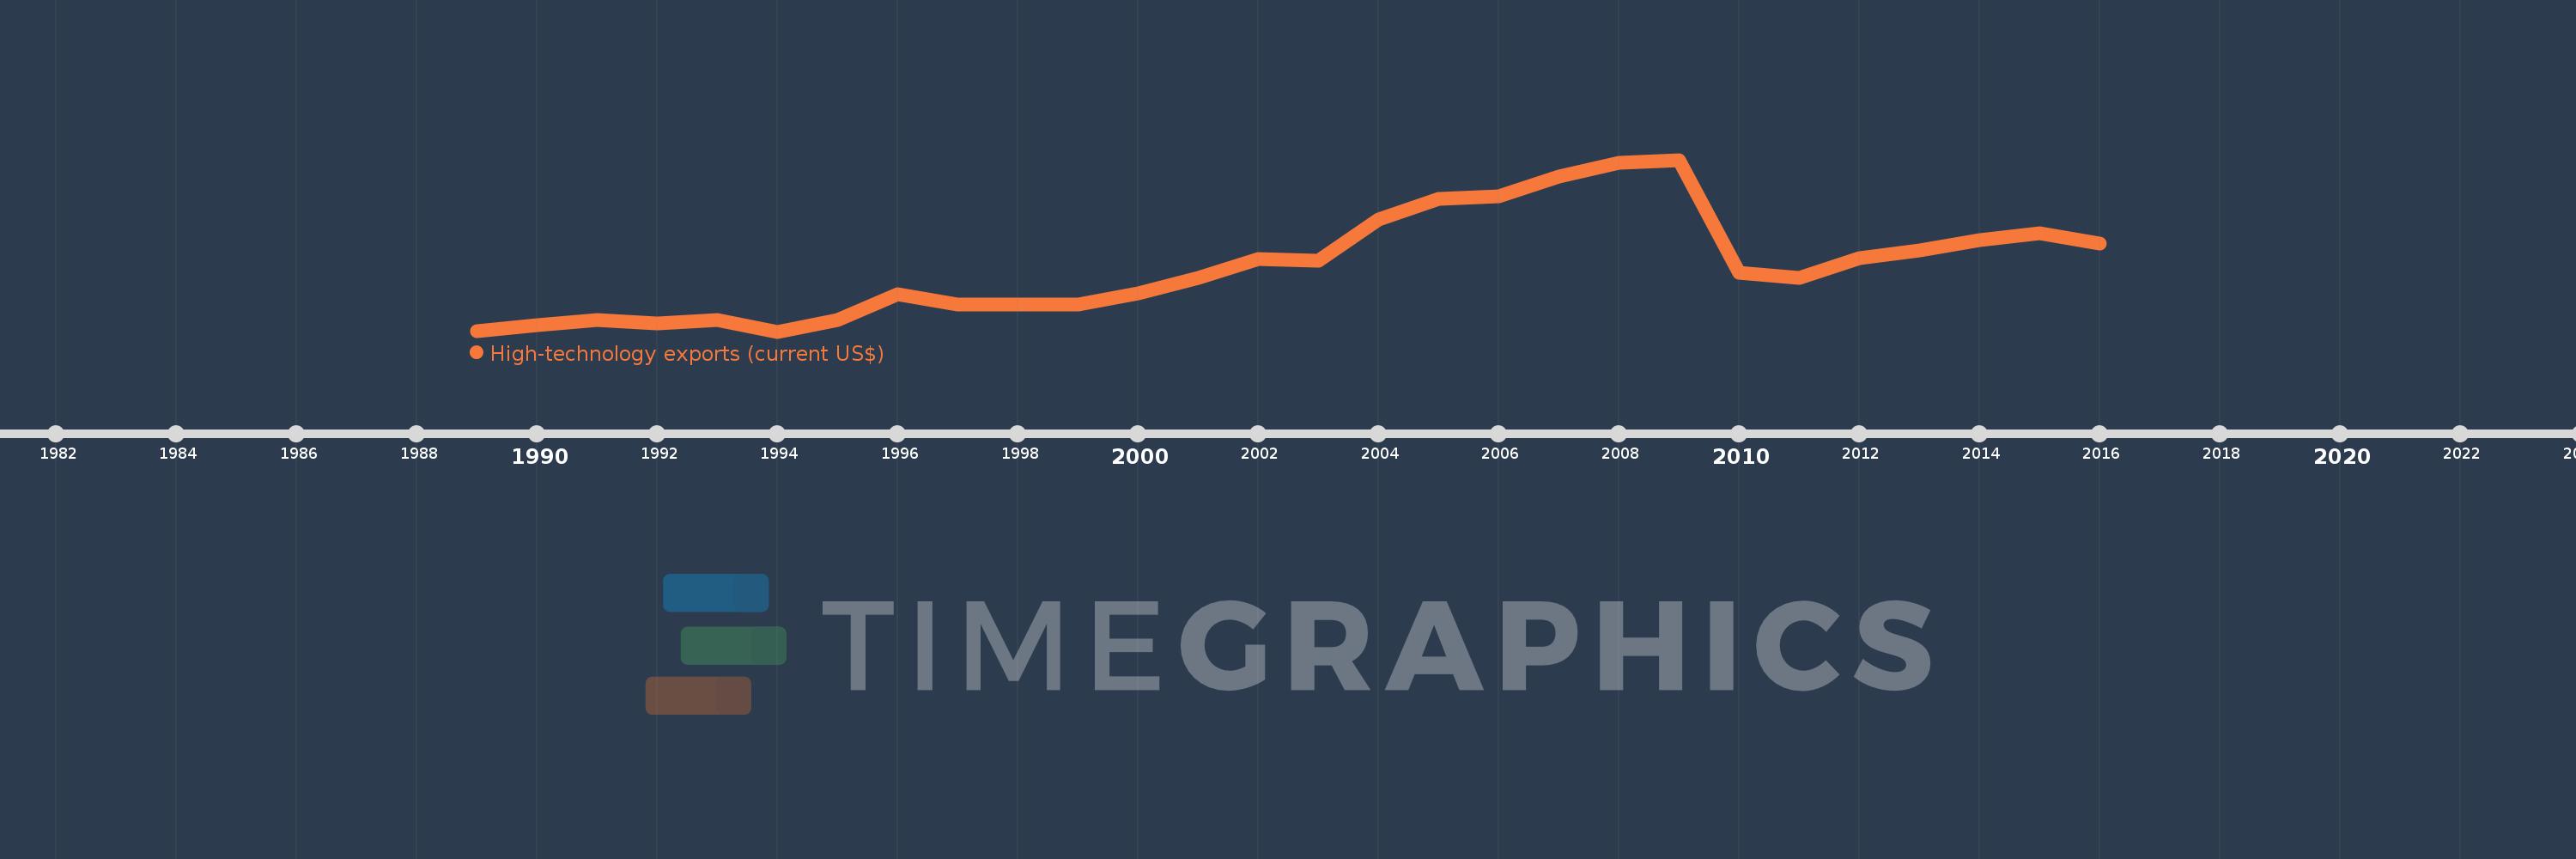
High-technology exports (current US$)
2016,2015,2014,2013,2012,2011,2010,2009,2008,2007,2006,2005,2004,2003,2002,2001,2000,1999,1998,1997,1996,1995,1994,1993,1992,1991,1990,1989
This statistics in other country:
AlbaniaAlgeriaAndorraAntigua and BarbudaArab WorldArgentinaArmeniaArubaAustraliaAustriaAzerbaijanBahamas, TheBahrainBangladeshBarbadosBelarusBelgiumBelizeBeninBermudaBhutanBoliviaBosnia and HerzegovinaBotswanaBrazilBrunei DarussalamBulgariaBurkina FasoBurundiCabo VerdeCambodiaCameroonCanadaCaribbean small statesCentral African RepublicCentral Europe and the BalticsChileChinaColombiaComorosCongo, Rep.Costa RicaCote d'IvoireCroatiaCubaCyprusCzech RepublicDenmarkDjiboutiDominicaDominican RepublicEarly-demographic dividendEast Asia & PacificEcuadorEgypt, Arab Rep.El SalvadorEritreaEstoniaEthiopiaEuro areaEurope & Central AsiaEurope & Central Asia (excluding high income)Europe & Central Asia (IDA & IBRD countries)European UnionFaroe IslandsFijiFinlandFranceFrench PolynesiaGabonGambia, TheGeorgiaGermanyGhanaGreeceGreenlandGrenadaGuatemalaGuineaGuinea-BissauGuyanaHaitiHeavily indebted poor countries (HIPC)High incomeHondurasHong Kong SAR, ChinaHungaryIBRD onlyIcelandIDA & IBRD totalIDA blendIDA onlyIDA totalIndiaIndonesiaIran, Islamic Rep.IraqIrelandIsraelItalyJamaicaJapanJordanKazakhstanKenyaKiribatiKorea, Rep.KuwaitKyrgyz RepublicLate-demographic dividendLatin America & Caribbean Latin America & Caribbean (excluding high income)Latin America & the Caribbean (IDA & IBRD countries)LatviaLebanonLesothoLithuaniaLow & middle incomeLow incomeLower middle incomeLuxembourgMacao SAR, ChinaMacedonia, FYRMadagascarMalawiMalaysiaMaldivesMaliMaltaMauritiusMexicoMiddle East & North AfricaMiddle East & North Africa (excluding high income)Middle East & North Africa (IDA & IBRD countries)Middle incomeMoldovaMongoliaMontenegroMoroccoMozambiqueMyanmarNamibiaNepalNetherlandsNew CaledoniaNew ZealandNicaraguaNigerNigeriaNorth AmericaNorwayOECD membersOmanOther small statesPakistanPalauPanamaPapua New GuineaParaguayPeruPhilippinesPolandPortugalPost-demographic dividendQatarRomaniaRussian FederationRwandaSamoaSao Tome and PrincipeSaudi ArabiaSenegalSerbiaSeychellesSierra LeoneSingaporeSlovak RepublicSloveniaSmall statesSolomon IslandsSouth AfricaSouth AsiaSouth Asia (IDA & IBRD)South SudanSpainSri LankaSt. Kitts and NevisSt. LuciaSt. Vincent and the GrenadinesSub-Saharan Africa Sub-Saharan Africa (excluding high income)Sub-Saharan Africa (IDA & IBRD countries)SudanSurinameSwazilandSwedenSwitzerlandSyrian Arab RepublicTajikistanTanzaniaThailandTimor-LesteTogoTongaTrinidad and TobagoTunisiaTurkeyTurkmenistanTurks and Caicos IslandsTuvaluUgandaUkraineUnited Arab EmiratesUnited KingdomUnited StatesUpper middle incomeUruguayVanuatuVenezuela, RBVietnamWest Bank and GazaWorldYemen, Rep.ZambiaZimbabwe Timeline:
This timeline shows a graph from 1989 to 2016 of Portugal. No data until 1988. Number of actual observations by date: 28.
Source name:
World Development Indicators
Source organization:
United Nations, Comtrade database.
Categories, topics:
Private Sector, Science & Technology, Trade
Last updated:
apr 23, 2017
Indicators value changes by year
Minimum:
340.256 mln
jan 1, 1994
Maximum:
3.388 bln
jan 1, 2009
At the date of observation
Value
Absolute change
Change from previous value
jan 1, 1989
343.563 mln
+343.563 mln
0.0%
jan 1, 1990
448.825 mln
+105.261 mln
30.64%
jan 1, 1991
543.658 mln
+94.833 mln
21.13%
jan 1, 1992
489.959 mln
-53.698 mln
-9.88%
jan 1, 1993
542.422 mln
+52.462 mln
10.71%
jan 1, 1994
340.256 mln
-202.166 mln
-37.27%
jan 1, 1995
538.825 mln
+198.57 mln
58.36%
jan 1, 1996
996.13 mln
+457.305 mln
84.87%
jan 1, 1997
812.641 mln
-183.489 mln
-18.42%
jan 1, 1998
817.718 mln
+5.077 mln
0.62%
jan 1, 1999
826.733 mln
+9.015 mln
1.1%
jan 1, 2000
1.016 bln
+189.621 mln
22.94%
jan 1, 2001
1.292 bln
+275.271 mln
27.08%
jan 1, 2002
1.623 bln
+330.971 mln
25.62%
jan 1, 2003
1.601 bln
-21.428 mln
-1.32%
jan 1, 2004
2.322 bln
+720.54 mln
45.0%
jan 1, 2005
2.701 bln
+379.342 mln
16.34%
jan 1, 2006
2.746 bln
+45.258 mln
1.68%
jan 1, 2007
3.096 bln
+349.844 mln
12.74%
jan 1, 2008
3.341 bln
+245.328 mln
7.92%
jan 1, 2009
3.388 bln
+46.343 mln
1.39%
jan 1, 2010
1.387 bln
-2.001 bln
-59.06%
jan 1, 2011
1.297 bln
-90.004 mln
-6.49%
jan 1, 2012
1.645 bln
+347.651 mln
26.8%
jan 1, 2013
1.775 bln
+130.162 mln
7.91%
jan 1, 2014
1.964 bln
+189.48 mln
10.68%
jan 1, 2015
2.089 bln
+124.502 mln
6.34%
jan 1, 2016
1.905 bln
-184.259 mln
-8.82%
Ranking of countries by current statistics by years


Comments: