29
/
en
AIzaSyAYiBZKx7MnpbEhh9jyipgxe19OcubqV5w
April 1, 2024
208029
Netherlands
NLD
true
2
1
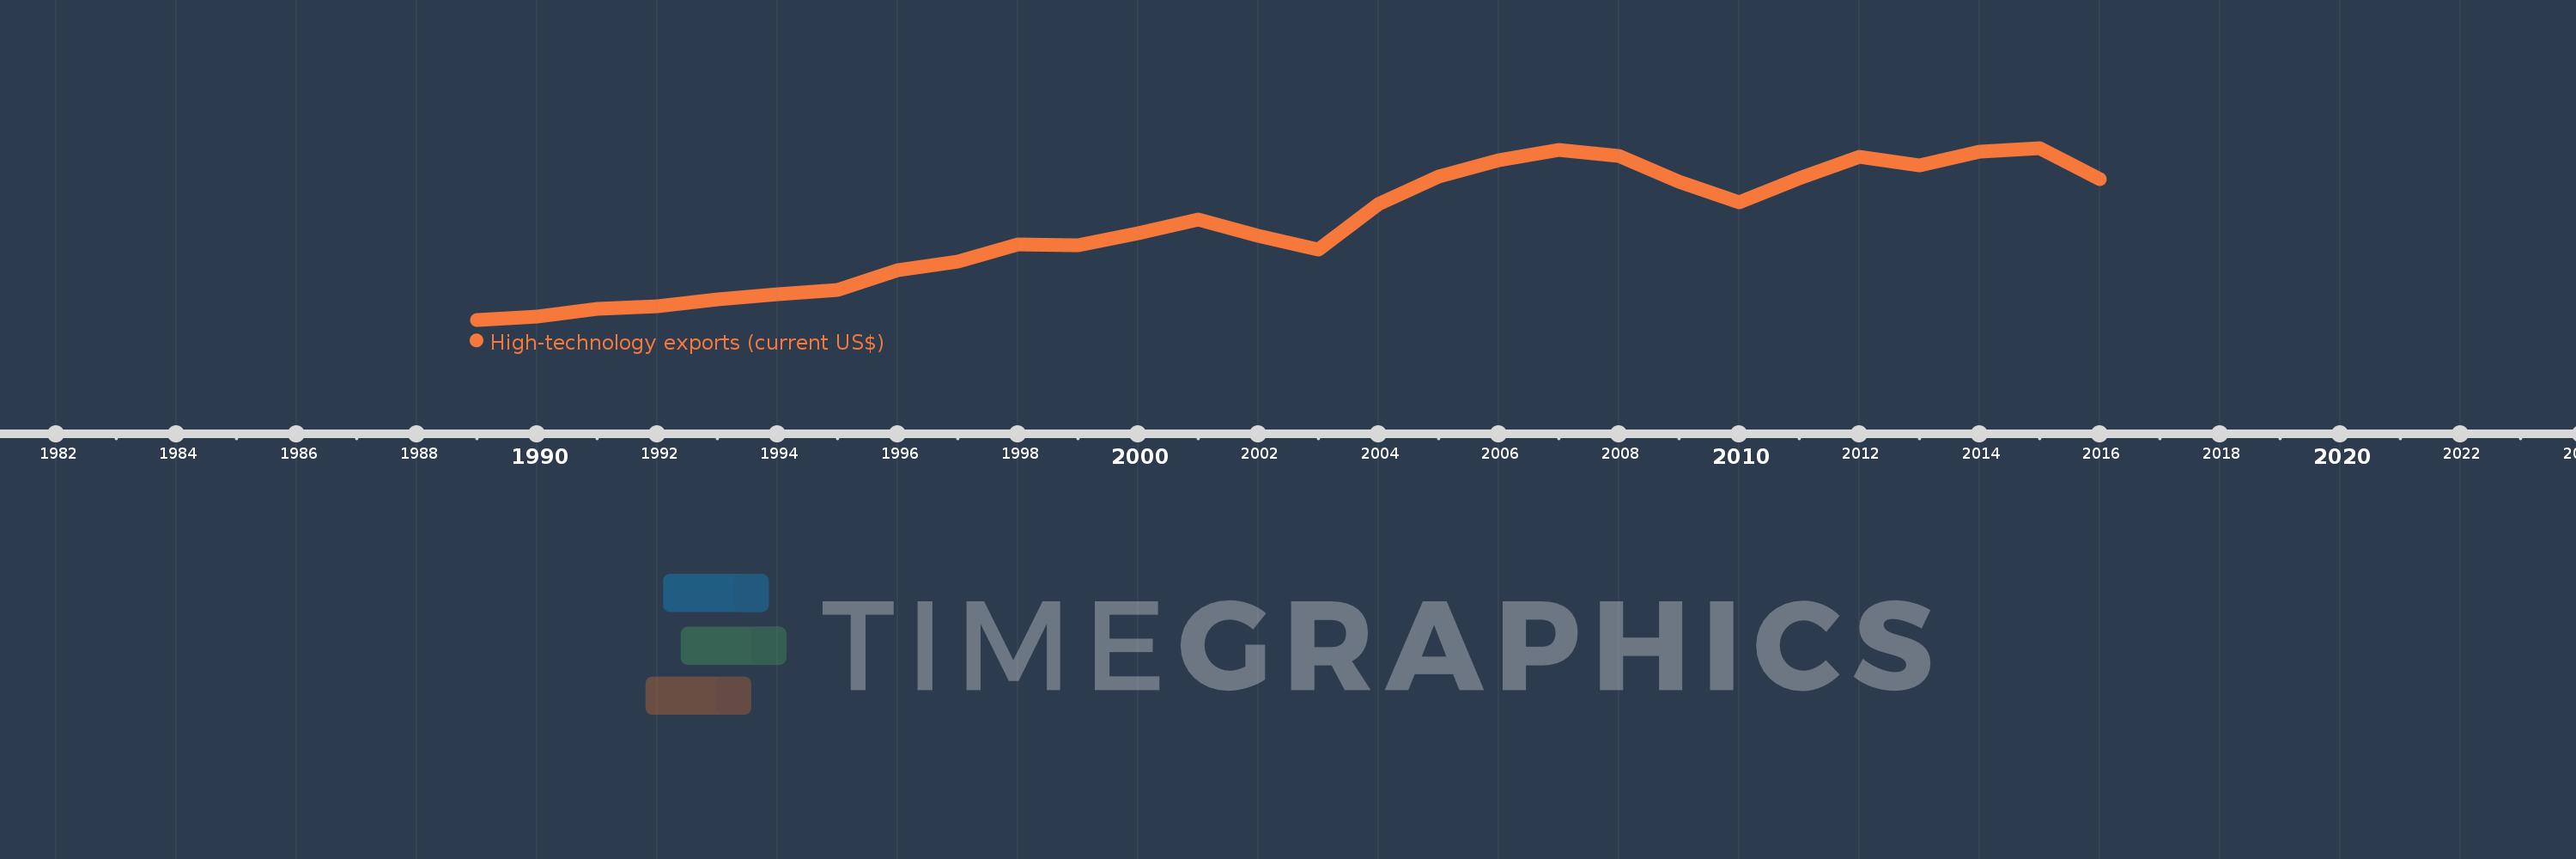
High-technology exports (current US$)
2016,2015,2014,2013,2012,2011,2010,2009,2008,2007,2006,2005,2004,2003,2002,2001,2000,1999,1998,1997,1996,1995,1994,1993,1992,1991,1990,1989
This statistics in other country:
AlbaniaAlgeriaAndorraAntigua and BarbudaArab WorldArgentinaArmeniaArubaAustraliaAustriaAzerbaijanBahamas, TheBahrainBangladeshBarbadosBelarusBelgiumBelizeBeninBermudaBhutanBoliviaBosnia and HerzegovinaBotswanaBrazilBrunei DarussalamBulgariaBurkina FasoBurundiCabo VerdeCambodiaCameroonCanadaCaribbean small statesCentral African RepublicCentral Europe and the BalticsChileChinaColombiaComorosCongo, Rep.Costa RicaCote d'IvoireCroatiaCubaCyprusCzech RepublicDenmarkDjiboutiDominicaDominican RepublicEarly-demographic dividendEast Asia & PacificEcuadorEgypt, Arab Rep.El SalvadorEritreaEstoniaEthiopiaEuro areaEurope & Central AsiaEurope & Central Asia (excluding high income)Europe & Central Asia (IDA & IBRD countries)European UnionFaroe IslandsFijiFinlandFranceFrench PolynesiaGabonGambia, TheGeorgiaGermanyGhanaGreeceGreenlandGrenadaGuatemalaGuineaGuinea-BissauGuyanaHaitiHeavily indebted poor countries (HIPC)High incomeHondurasHong Kong SAR, ChinaHungaryIBRD onlyIcelandIDA & IBRD totalIDA blendIDA onlyIDA totalIndiaIndonesiaIran, Islamic Rep.IraqIrelandIsraelItalyJamaicaJapanJordanKazakhstanKenyaKiribatiKorea, Rep.KuwaitKyrgyz RepublicLate-demographic dividendLatin America & Caribbean Latin America & Caribbean (excluding high income)Latin America & the Caribbean (IDA & IBRD countries)LatviaLebanonLesothoLithuaniaLow & middle incomeLow incomeLower middle incomeLuxembourgMacao SAR, ChinaMacedonia, FYRMadagascarMalawiMalaysiaMaldivesMaliMaltaMauritiusMexicoMiddle East & North AfricaMiddle East & North Africa (excluding high income)Middle East & North Africa (IDA & IBRD countries)Middle incomeMoldovaMongoliaMontenegroMoroccoMozambiqueMyanmarNamibiaNepalNetherlandsNew CaledoniaNew ZealandNicaraguaNigerNigeriaNorth AmericaNorwayOECD membersOmanOther small statesPakistanPalauPanamaPapua New GuineaParaguayPeruPhilippinesPolandPortugalPost-demographic dividendQatarRomaniaRussian FederationRwandaSamoaSao Tome and PrincipeSaudi ArabiaSenegalSerbiaSeychellesSierra LeoneSingaporeSlovak RepublicSloveniaSmall statesSolomon IslandsSouth AfricaSouth AsiaSouth Asia (IDA & IBRD)South SudanSpainSri LankaSt. Kitts and NevisSt. LuciaSt. Vincent and the GrenadinesSub-Saharan Africa Sub-Saharan Africa (excluding high income)Sub-Saharan Africa (IDA & IBRD countries)SudanSurinameSwazilandSwedenSwitzerlandSyrian Arab RepublicTajikistanTanzaniaThailandTimor-LesteTogoTongaTrinidad and TobagoTunisiaTurkeyTurkmenistanTurks and Caicos IslandsTuvaluUgandaUkraineUnited Arab EmiratesUnited KingdomUnited StatesUpper middle incomeUruguayVanuatuVenezuela, RBVietnamWest Bank and GazaWorldYemen, Rep.ZambiaZimbabwe Timeline:
This timeline shows a graph from 1989 to 2016 of Netherlands. No data until 1988. Number of actual observations by date: 28.
Source name:
World Development Indicators
Source organization:
United Nations, Comtrade database.
Categories, topics:
Private Sector, Science & Technology, Trade
Last updated:
apr 23, 2017
Indicators value changes by year
Minimum:
9.0 bln
jan 1, 1989
Maximum:
70.308 bln
jan 1, 2015
At the date of observation
Value
Absolute change
Change from previous value
jan 1, 1989
9.0 bln
+9.0 bln
0.0%
jan 1, 1990
10.065 bln
+1.065 bln
11.83%
jan 1, 1991
12.853 bln
+2.789 bln
27.71%
jan 1, 1992
13.928 bln
+1.075 bln
8.36%
jan 1, 1993
16.18 bln
+2.252 bln
16.17%
jan 1, 1994
18.142 bln
+1.962 bln
12.12%
jan 1, 1995
19.711 bln
+1.569 bln
8.65%
jan 1, 1996
26.801 bln
+7.091 bln
35.97%
jan 1, 1997
29.83 bln
+3.029 bln
11.3%
jan 1, 1998
35.843 bln
+6.013 bln
20.16%
jan 1, 1999
35.679 bln
-164.367 mln
-0.46%
jan 1, 2000
39.909 bln
+4.231 bln
11.86%
jan 1, 2001
44.879 bln
+4.97 bln
12.45%
jan 1, 2002
38.962 bln
-5.917 bln
-13.18%
jan 1, 2003
34.099 bln
-4.864 bln
-12.48%
jan 1, 2004
50.241 bln
+16.143 bln
47.34%
jan 1, 2005
60.073 bln
+9.832 bln
19.57%
jan 1, 2006
65.91 bln
+5.837 bln
9.72%
jan 1, 2007
69.51 bln
+3.6 bln
5.46%
jan 1, 2008
67.416 bln
-2.094 bln
-3.01%
jan 1, 2009
58.128 bln
-9.289 bln
-13.78%
jan 1, 2010
50.765 bln
-7.363 bln
-12.67%
jan 1, 2011
59.51 bln
+8.745 bln
17.23%
jan 1, 2012
67.148 bln
+7.638 bln
12.83%
jan 1, 2013
64.139 bln
-3.009 bln
-4.48%
jan 1, 2014
69.04 bln
+4.9 bln
7.64%
jan 1, 2015
70.308 bln
+1.269 bln
1.84%
jan 1, 2016
59.128 bln
-11.18 bln
-15.9%
Ranking of countries by current statistics by years


Comments: