29
/
en
AIzaSyAYiBZKx7MnpbEhh9jyipgxe19OcubqV5w
April 1, 2024
150574
Honduras
HND
true
2
1
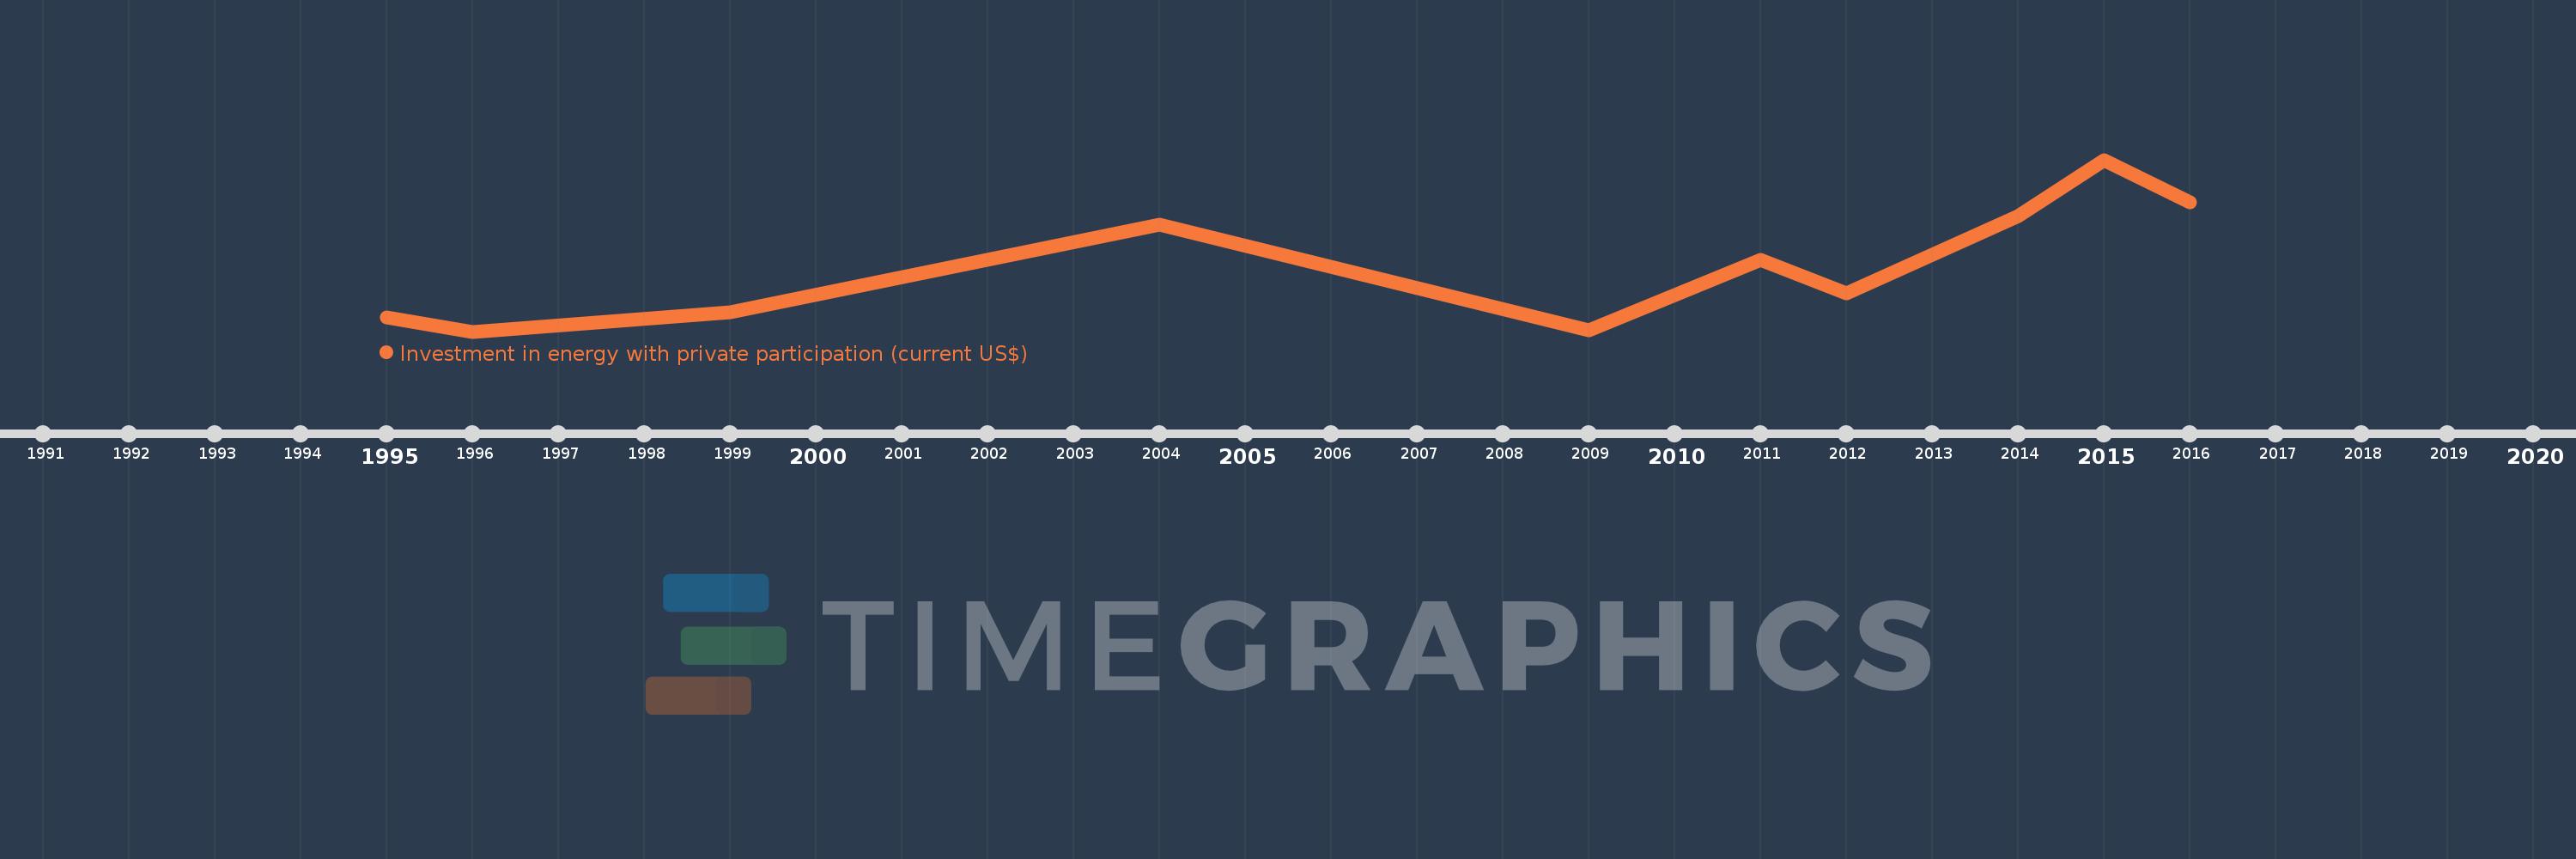
Investment in energy with private participation (current US$)
2016,2015,2014,2012,2011,2009,2004,1999,1996,1995
This statistics in other country:
Timeline:
This timeline shows a graph from 1995 to 2016 of Honduras. No data until 1994. Number of actual observations by date: 10.
Source name:
World Development Indicators
Source organization:
World Bank, Private Participation in Infrastructure Project Database (http://ppi.worldbank.org).
Categories, topics:
Energy & Mining, Infrastructure, Private Sector
Last updated:
apr 23, 2017
Indicators value changes by year
Minimum:
25.3 mln
jan 1, 1996
Maximum:
562.3 mln
jan 1, 2015
At the date of observation
Value
Absolute change
Change from previous value
jan 1, 1995
70.0 mln
+70.0 mln
0.0%
jan 1, 1996
25.3 mln
-44.7 mln
-63.86%
jan 1, 1999
86.8 mln
+61.5 mln
243.08%
jan 1, 2004
358.8 mln
+272.0 mln
313.36%
jan 1, 2009
30.0 mln
-328.8 mln
-91.64%
jan 1, 2011
250.0 mln
+220.0 mln
733.33%
jan 1, 2012
144.5 mln
-105.5 mln
-42.2%
jan 1, 2014
385.6 mln
+241.1 mln
166.85%
jan 1, 2015
562.3 mln
+176.7 mln
45.82%
jan 1, 2016
430.0 mln
-132.3 mln
-23.53%
Ranking of countries by current statistics by years


Comments: