29
/
en
AIzaSyAYiBZKx7MnpbEhh9jyipgxe19OcubqV5w
April 1, 2024
195751
Mexico
MEX
true
2
1
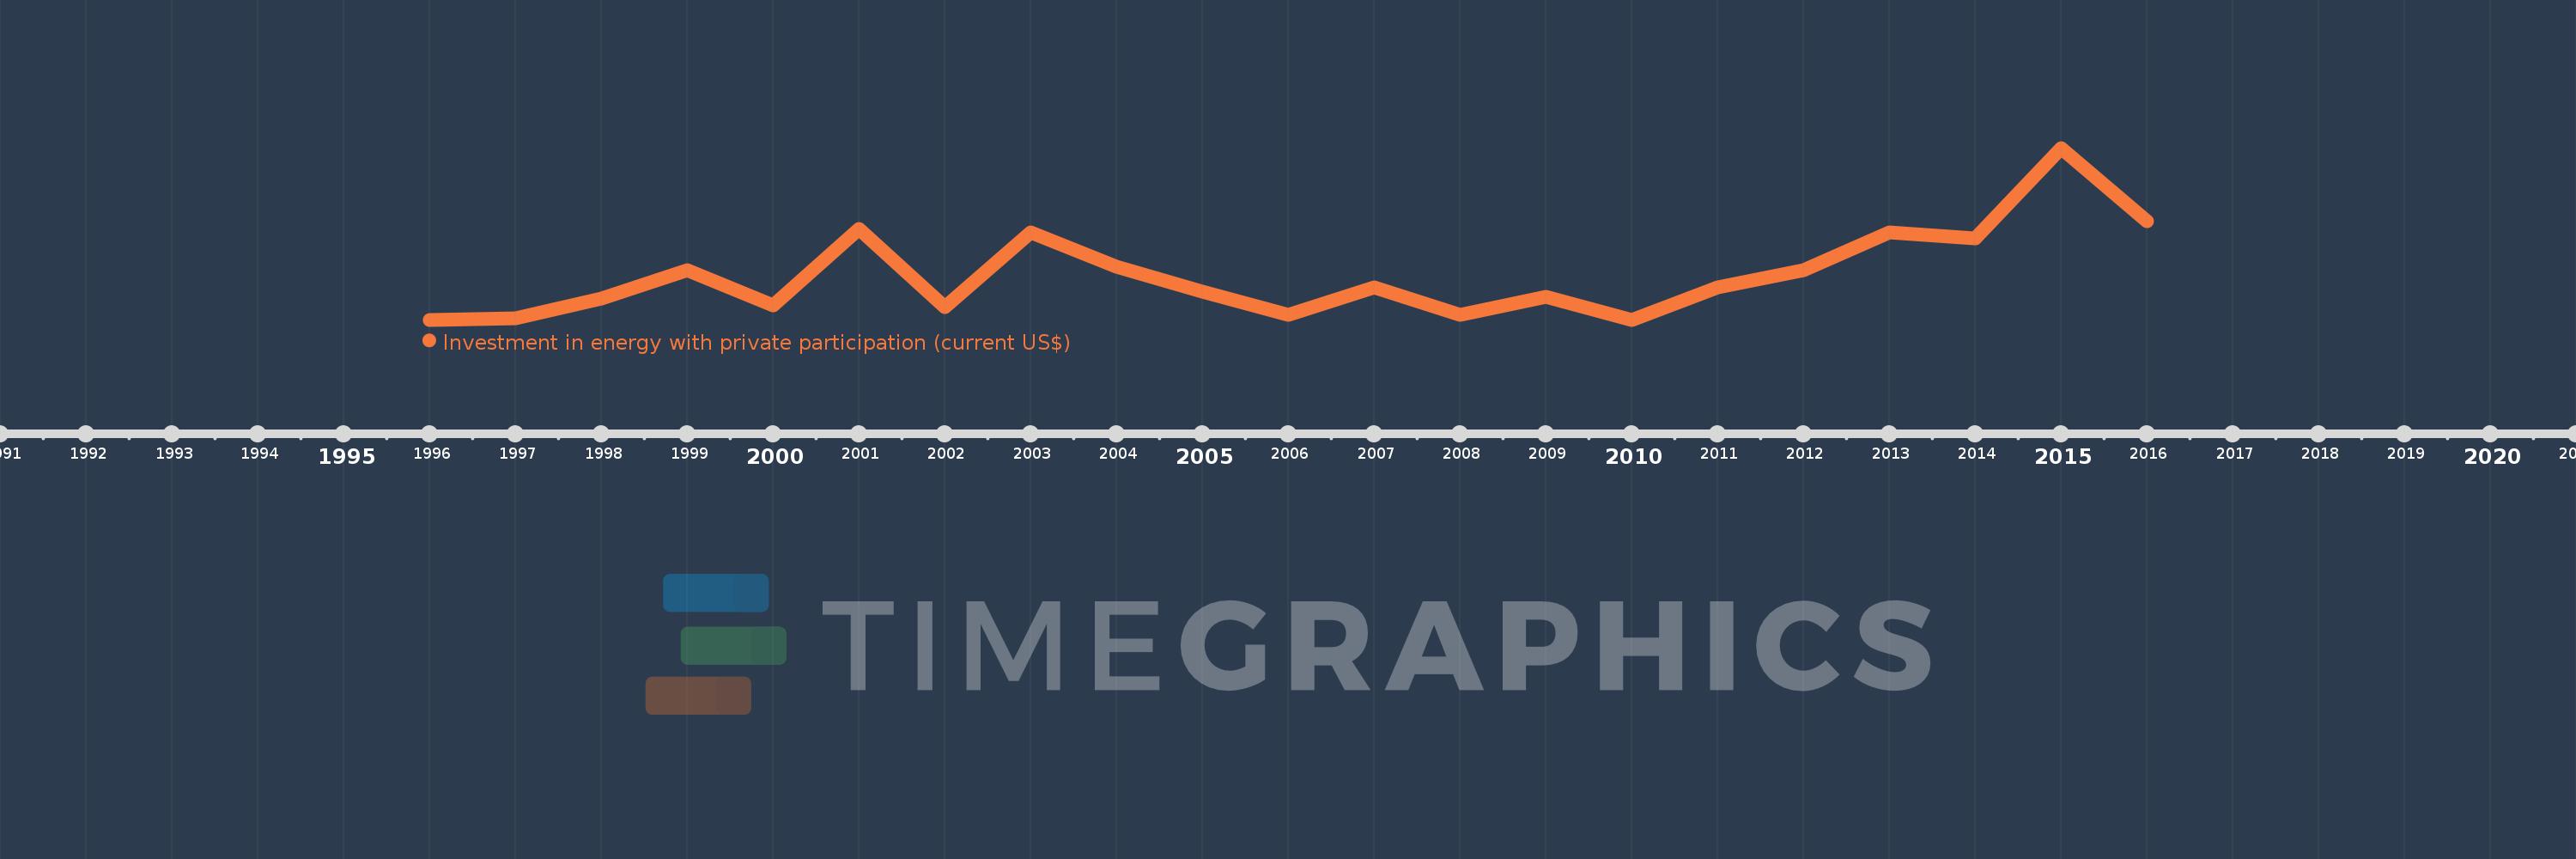
Investment in energy with private participation (current US$)
2016,2015,2014,2013,2012,2011,2010,2009,2008,2007,2006,2005,2004,2003,2002,2001,2000,1999,1998,1997,1996
This statistics in other country:
Timeline:
This timeline shows a graph from 1996 to 2016 of Mexico. No data until 1995. Number of actual observations by date: 21.
Source name:
World Development Indicators
Source organization:
World Bank, Private Participation in Infrastructure Project Database (http://ppi.worldbank.org).
Categories, topics:
Energy & Mining, Infrastructure, Private Sector
Last updated:
apr 23, 2017
Indicators value changes by year
Maximum:
4.194 bln
jan 1, 2015
At the date of observation
Value
Absolute change
Change from previous value
jan 1, 1996
1000.0K
+1000.0K
0.0%
jan 1, 1997
43.5 mln
+42.5 mln
4.25K%
jan 1, 1998
526.3 mln
+482.8 mln
1.11K%
jan 1, 1999
1.202 bln
+675.2 mln
128.29%
jan 1, 2000
348.5 mln
-853.0 mln
-70.99%
jan 1, 2001
2.214 bln
+1.866 bln
535.38%
jan 1, 2002
311.0 mln
-1.903 bln
-85.95%
jan 1, 2003
2.124 bln
+1.813 bln
582.96%
jan 1, 2004
1.285 bln
-839.0 mln
-39.5%
jan 1, 2005
695.0 mln
-590.0 mln
-45.91%
jan 1, 2006
120.0 mln
-575.0 mln
-82.73%
jan 1, 2007
801.0 mln
+681.0 mln
567.5%
jan 1, 2008
120.0 mln
-681.0 mln
-85.02%
jan 1, 2009
562.0 mln
+442.0 mln
368.33%
jan 1, 2010
0.0
-562.0 mln
-100.0%
jan 1, 2011
799.7 mln
+799.7 mln
%
jan 1, 2012
1.207 bln
+407.3 mln
50.93%
jan 1, 2013
2.13 bln
+922.5 mln
76.43%
jan 1, 2014
1.982 bln
-147.9 mln
-6.95%
jan 1, 2015
4.194 bln
+2.212 bln
111.65%
jan 1, 2016
2.405 bln
-1.789 bln
-42.66%
Ranking of countries by current statistics by years


Comments: