29
/
en
AIzaSyAYiBZKx7MnpbEhh9jyipgxe19OcubqV5w
April 1, 2024
140580
Ghana
GHA
true
2
1
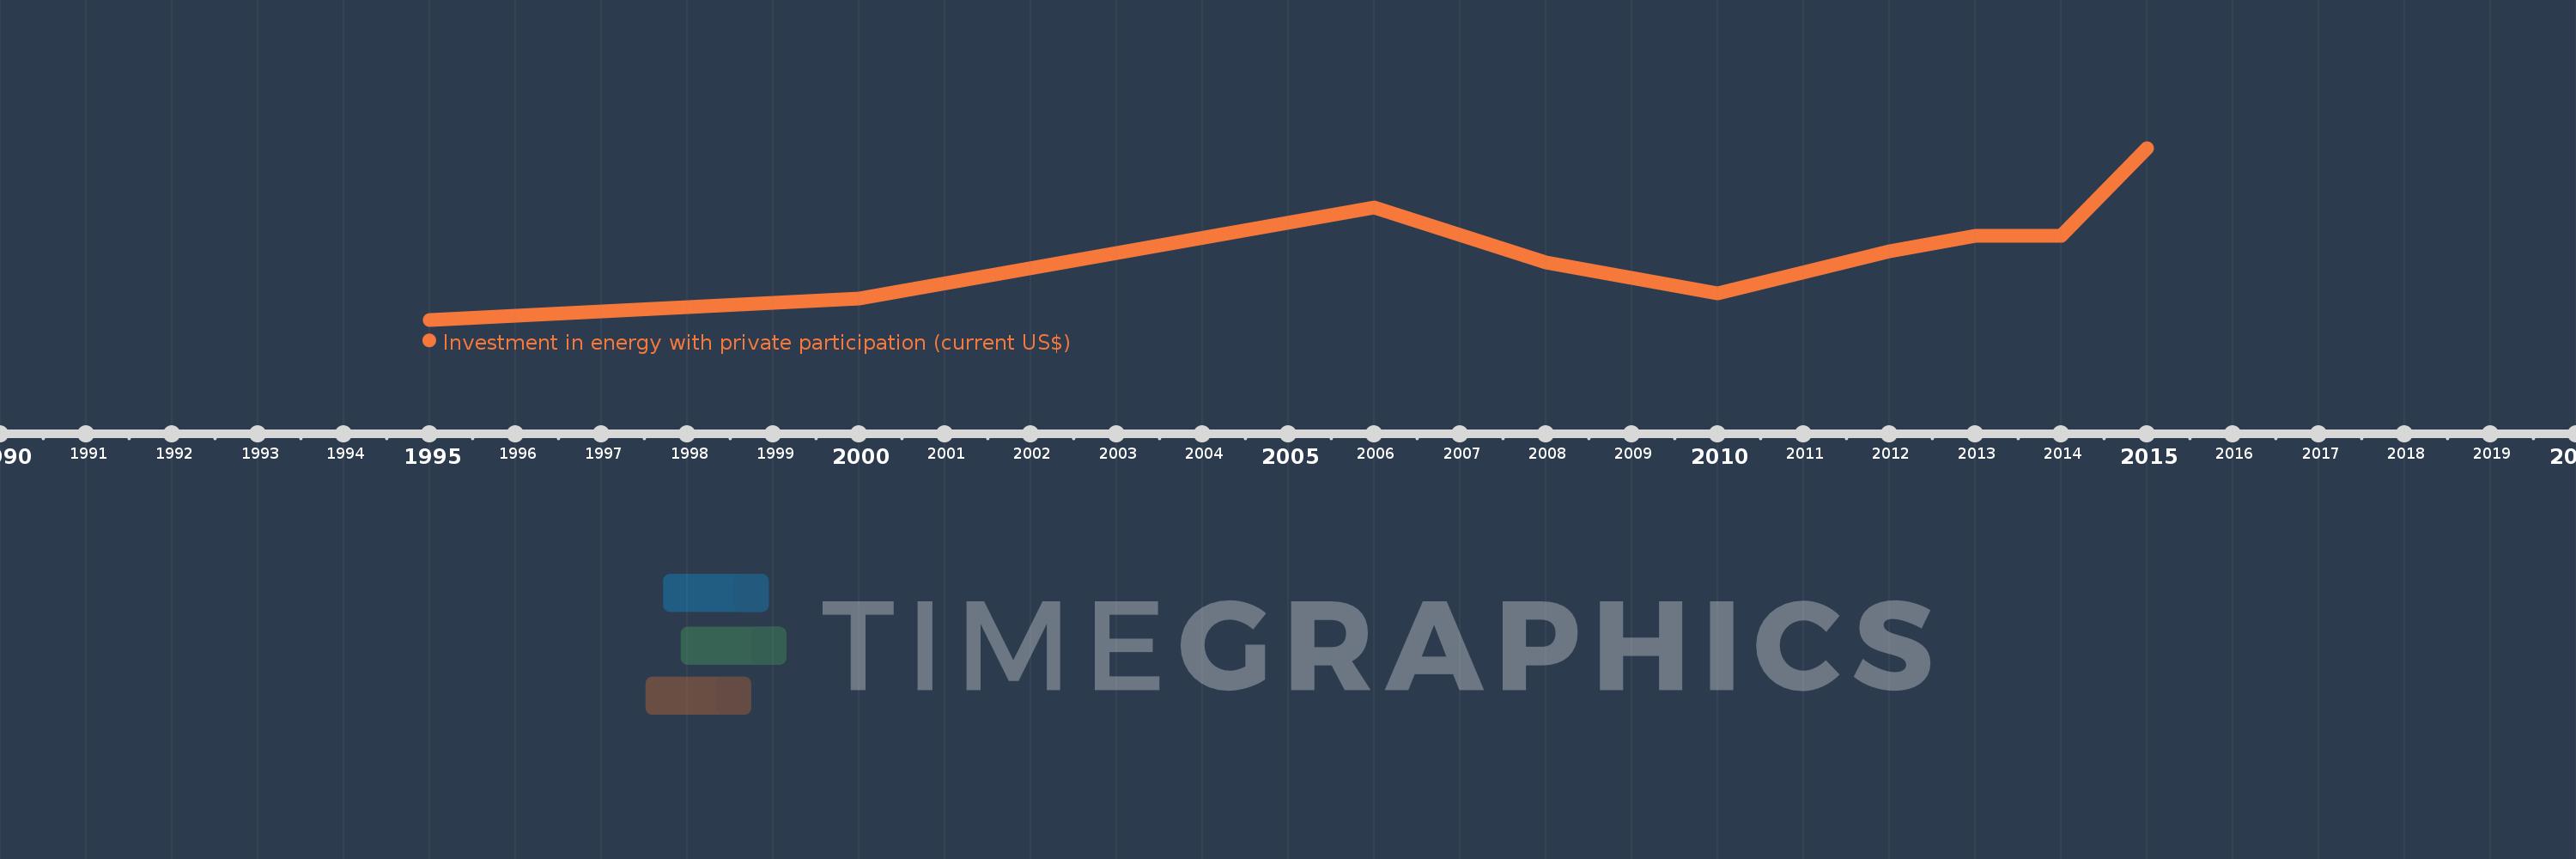
Investment in energy with private participation (current US$)
2015,2014,2013,2012,2010,2008,2006,2000,1995
This statistics in other country:
Timeline:
This timeline shows a graph from 1995 to 2015 of Ghana. No data until 1994. Number of actual observations by date: 9.
Source name:
World Development Indicators
Source organization:
World Bank, Private Participation in Infrastructure Project Database (http://ppi.worldbank.org).
Categories, topics:
Energy & Mining, Infrastructure, Private Sector
Last updated:
apr 23, 2017
Indicators value changes by year
Maximum:
900.0 mln
jan 1, 2015
At the date of observation
Value
Absolute change
Change from previous value
jan 1, 2000
110.0 mln
+110.0 mln
%
jan 1, 2006
590.0 mln
+480.0 mln
436.36%
jan 1, 2008
300.0 mln
-290.0 mln
-49.15%
jan 1, 2010
140.0 mln
-160.0 mln
-53.33%
jan 1, 2012
360.0 mln
+220.0 mln
157.14%
jan 1, 2013
440.0 mln
+80.0 mln
22.22%
jan 1, 2014
440.0 mln
0.0
0.0%
jan 1, 2015
900.0 mln
+460.0 mln
104.55%
Ranking of countries by current statistics by years


Comments: