29
/
en
AIzaSyAYiBZKx7MnpbEhh9jyipgxe19OcubqV5w
April 1, 2024
210569
Nicaragua
NIC
true
2
1
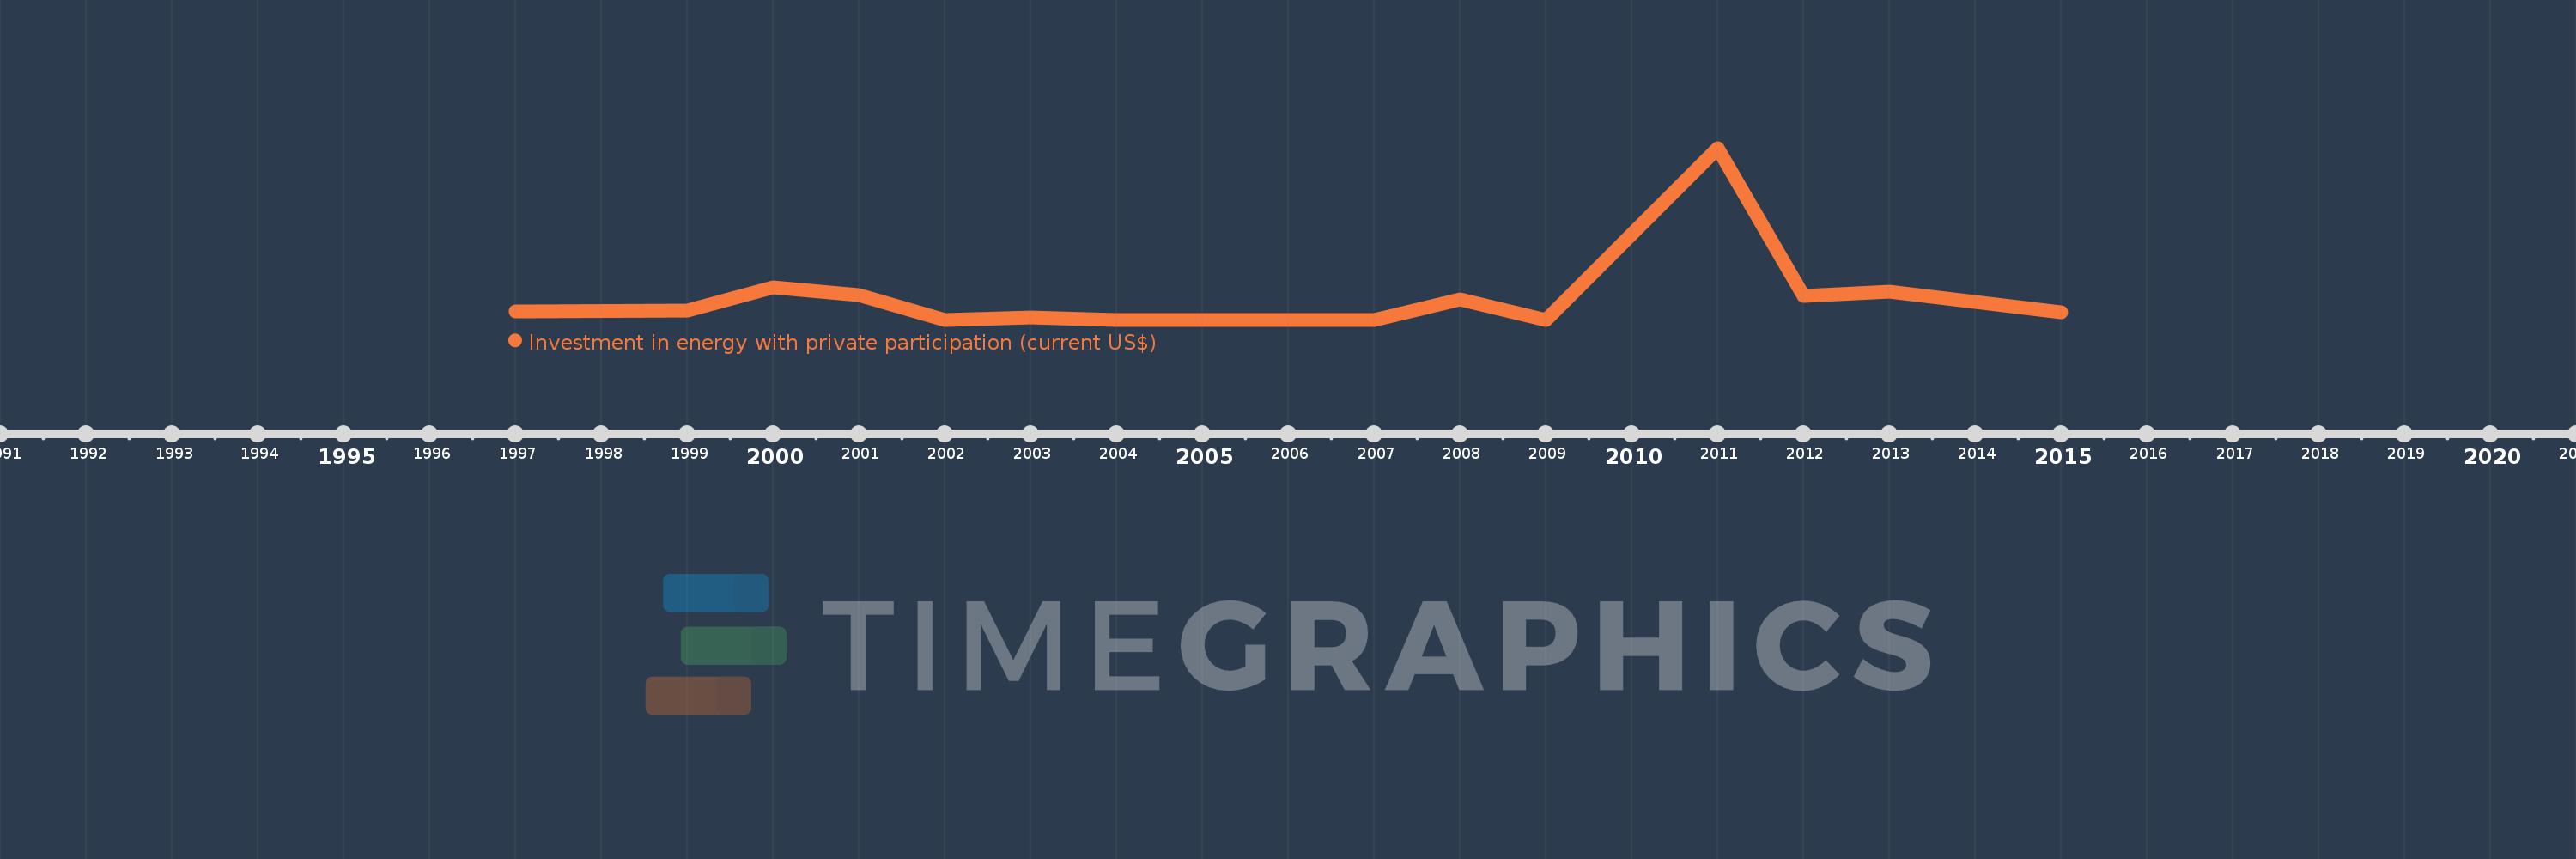
Investment in energy with private participation (current US$)
2015,2013,2012,2011,2009,2008,2007,2006,2005,2004,2003,2002,2001,2000,1999,1997
This statistics in other country:
Timeline:
This timeline shows a graph from 1997 to 2015 of Nicaragua. No data until 1996. Number of actual observations by date: 16.
Source name:
World Development Indicators
Source organization:
World Bank, Private Participation in Infrastructure Project Database (http://ppi.worldbank.org).
Categories, topics:
Energy & Mining, Infrastructure, Private Sector
Last updated:
apr 23, 2017
Indicators value changes by year
Maximum:
795.0 mln
jan 1, 2011
At the date of observation
Value
Absolute change
Change from previous value
jan 1, 1997
38.0 mln
+38.0 mln
0.0%
jan 1, 1999
43.0 mln
+5.0 mln
13.16%
jan 1, 2000
151.4 mln
+108.4 mln
252.09%
jan 1, 2001
115.0 mln
-36.4 mln
-24.04%
jan 1, 2002
0.0
-115.0 mln
-100.0%
jan 1, 2003
11.3 mln
+11.3 mln
%
jan 1, 2004
0.0
-11.3 mln
-100.0%
jan 1, 2008
95.0 mln
+95.0 mln
%
jan 1, 2009
0.0
-95.0 mln
-100.0%
jan 1, 2011
795.0 mln
+795.0 mln
%
jan 1, 2012
110.0 mln
-685.0 mln
-86.16%
jan 1, 2013
130.0 mln
+20.0 mln
18.18%
jan 1, 2015
33.0 mln
-97.0 mln
-74.62%
Ranking of countries by current statistics by years


Comments: