29
/
en
AIzaSyAYiBZKx7MnpbEhh9jyipgxe19OcubqV5w
April 1, 2024
197750
Moldova
MDA
true
2
1
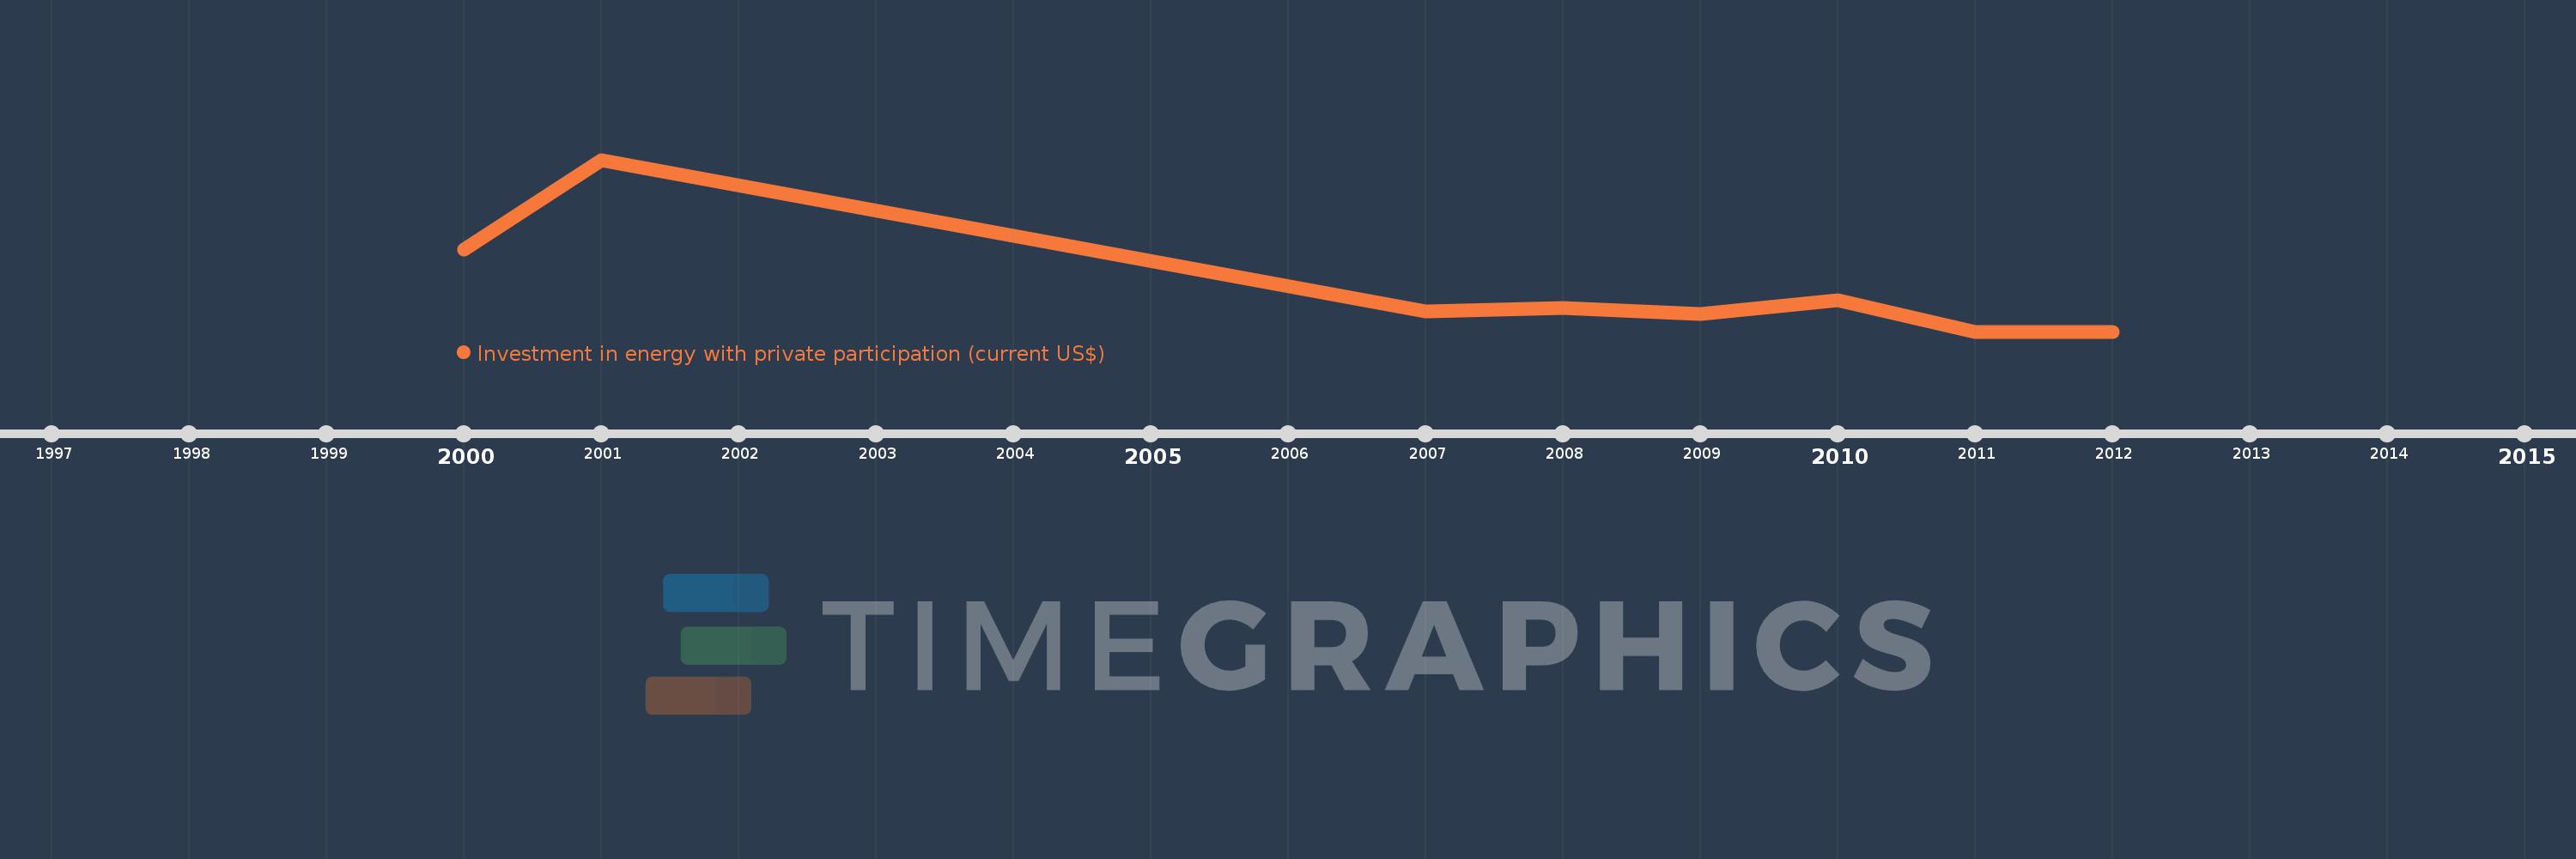
Investment in energy with private participation (current US$)
2012,2011,2010,2009,2008,2007,2001,2000
This statistics in other country:
Timeline:
This timeline shows a graph from 2000 to 2012 of Moldova. No data until 1999. Number of actual observations by date: 8.
Source name:
World Development Indicators
Source organization:
World Bank, Private Participation in Infrastructure Project Database (http://ppi.worldbank.org).
Categories, topics:
Energy & Mining, Infrastructure, Private Sector
Last updated:
apr 23, 2017
Indicators value changes by year
Maximum:
125.2 mln
jan 1, 2001
At the date of observation
Value
Absolute change
Change from previous value
jan 1, 2000
60.0 mln
+60.0 mln
0.0%
jan 1, 2001
125.2 mln
+65.2 mln
108.67%
jan 1, 2007
15.0 mln
-110.2 mln
-88.02%
jan 1, 2008
17.0 mln
+2.0 mln
13.33%
jan 1, 2009
13.0 mln
-4.0 mln
-23.53%
jan 1, 2010
23.0 mln
+10.0 mln
76.92%
jan 1, 2011
0.0
-23.0 mln
-100.0%
Ranking of countries by current statistics by years


Comments: