29
/
en
AIzaSyAYiBZKx7MnpbEhh9jyipgxe19OcubqV5w
April 1, 2024
124987
Egypt, Arab Rep.
EGY
true
2
1
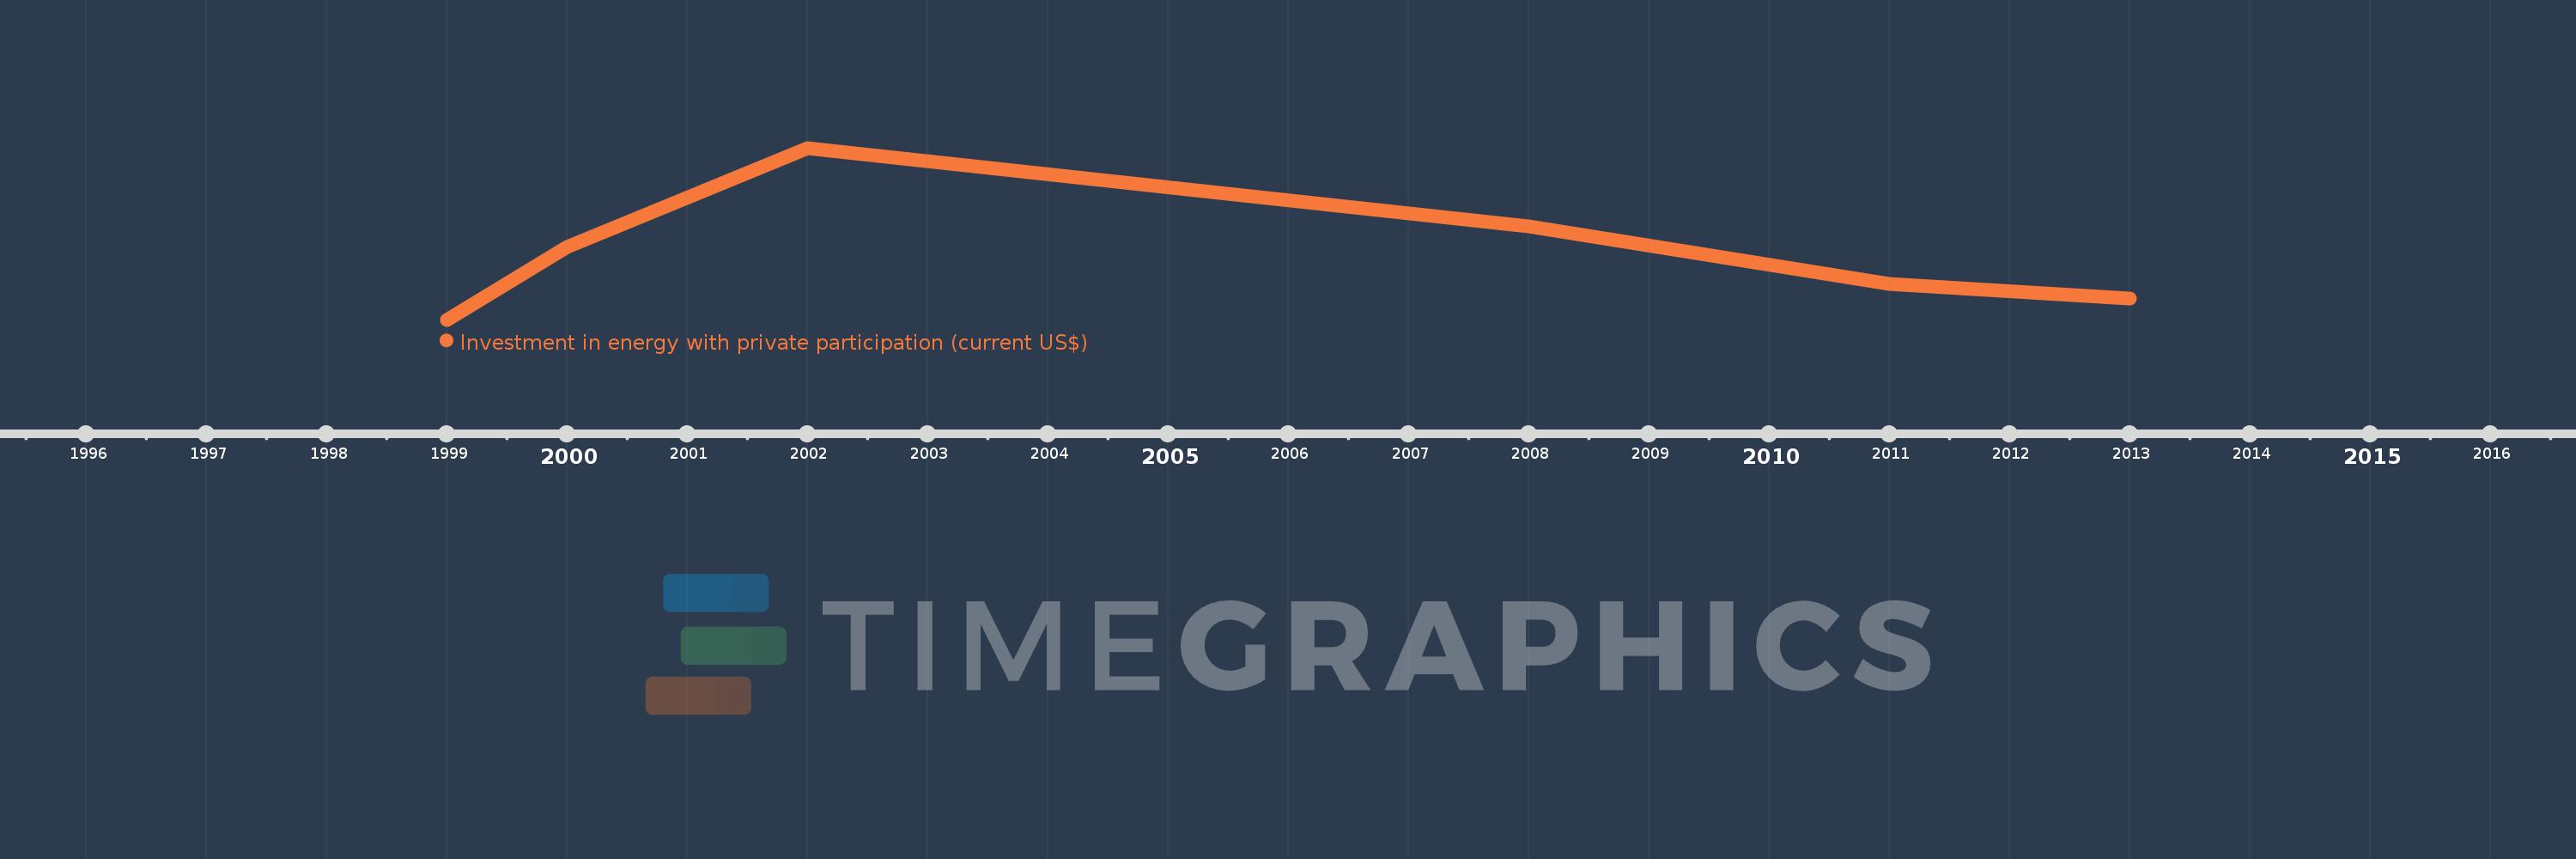
Investment in energy with private participation (current US$)
2013,2011,2008,2002,2000,1999
This statistics in other country:
Timeline:
This timeline shows a graph from 1999 to 2013 of Egypt, Arab Rep.. No data until 1998. Number of actual observations by date: 6.
Source name:
World Development Indicators
Source organization:
World Bank, Private Participation in Infrastructure Project Database (http://ppi.worldbank.org).
Categories, topics:
Energy & Mining, Infrastructure, Private Sector
Last updated:
apr 23, 2017
Indicators value changes by year
Minimum:
220.0 mln
jan 1, 1999
Maximum:
678.0 mln
jan 1, 2002
At the date of observation
Value
Absolute change
Change from previous value
jan 1, 1999
220.0 mln
+220.0 mln
0.0%
jan 1, 2000
414.0 mln
+194.0 mln
88.18%
jan 1, 2002
678.0 mln
+264.0 mln
63.77%
jan 1, 2008
469.0 mln
-209.0 mln
-30.83%
jan 1, 2011
314.7 mln
-154.3 mln
-32.9%
jan 1, 2013
276.0 mln
-38.7 mln
-12.3%
Ranking of countries by current statistics by years


Comments: