29
/
en
AIzaSyAYiBZKx7MnpbEhh9jyipgxe19OcubqV5w
April 1, 2024
277851
Uruguay
URY
true
2
1
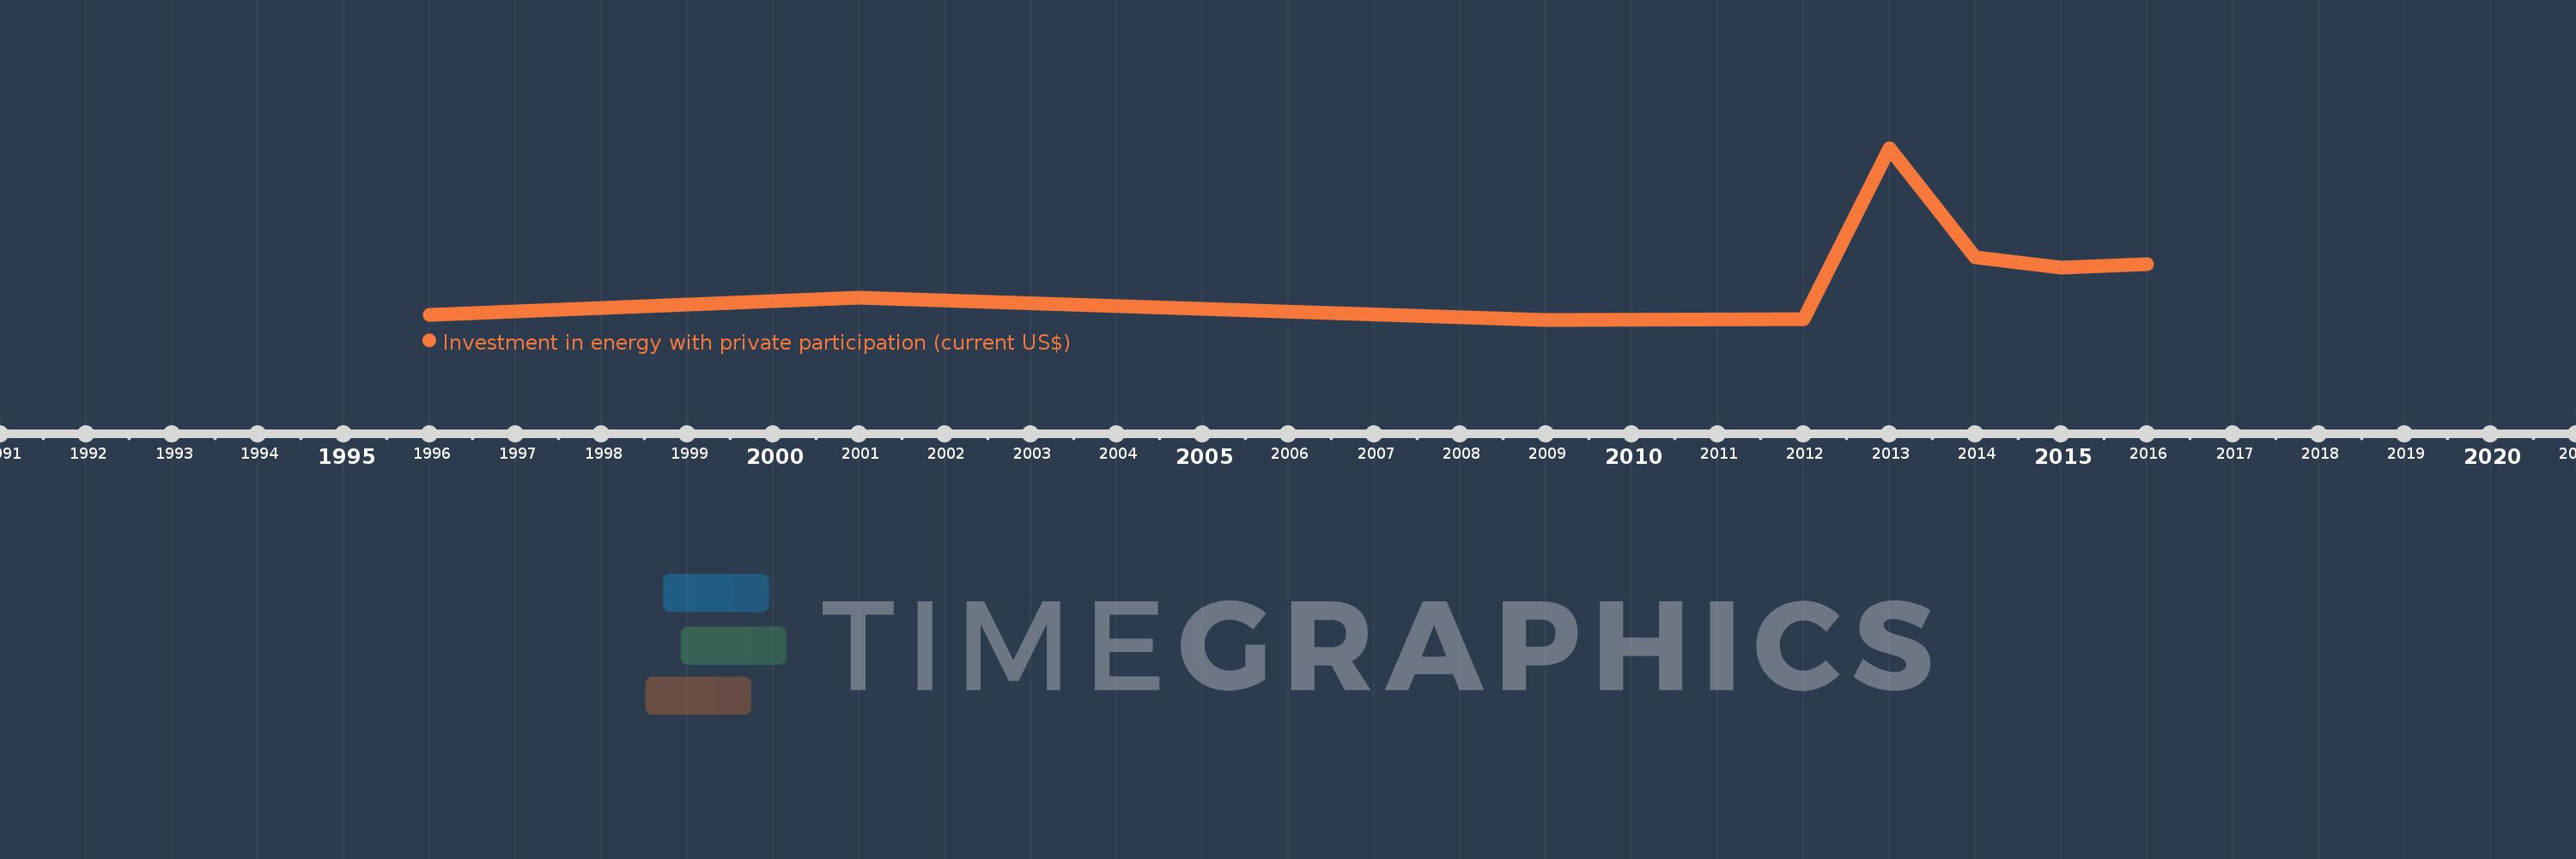
Investment in energy with private participation (current US$)
2016,2015,2014,2013,2012,2009,2001,1996
This statistics in other country:
Timeline:
This timeline shows a graph from 1996 to 2016 of Uruguay. No data until 1995. Number of actual observations by date: 8.
Source name:
World Development Indicators
Source organization:
World Bank, Private Participation in Infrastructure Project Database (http://ppi.worldbank.org).
Categories, topics:
Energy & Mining, Infrastructure, Private Sector
Last updated:
apr 23, 2017
Indicators value changes by year
Minimum:
15.0 mln
jan 1, 2009
Maximum:
2.421 bln
jan 1, 2013
At the date of observation
Value
Absolute change
Change from previous value
jan 1, 1996
86.0 mln
+86.0 mln
0.0%
jan 1, 2001
330.0 mln
+244.0 mln
283.72%
jan 1, 2009
15.0 mln
-315.0 mln
-95.45%
jan 1, 2012
20.0 mln
+5.0 mln
33.33%
jan 1, 2013
2.421 bln
+2.401 bln
12.01K%
jan 1, 2014
886.2 mln
-1.535 bln
-63.4%
jan 1, 2015
747.5 mln
-138.7 mln
-15.65%
jan 1, 2016
793.6 mln
+46.1 mln
6.17%
Ranking of countries by current statistics by years


Comments: