29
/
en
AIzaSyAYiBZKx7MnpbEhh9jyipgxe19OcubqV5w
April 1, 2024
64910
Albania
ALB
true
2
1
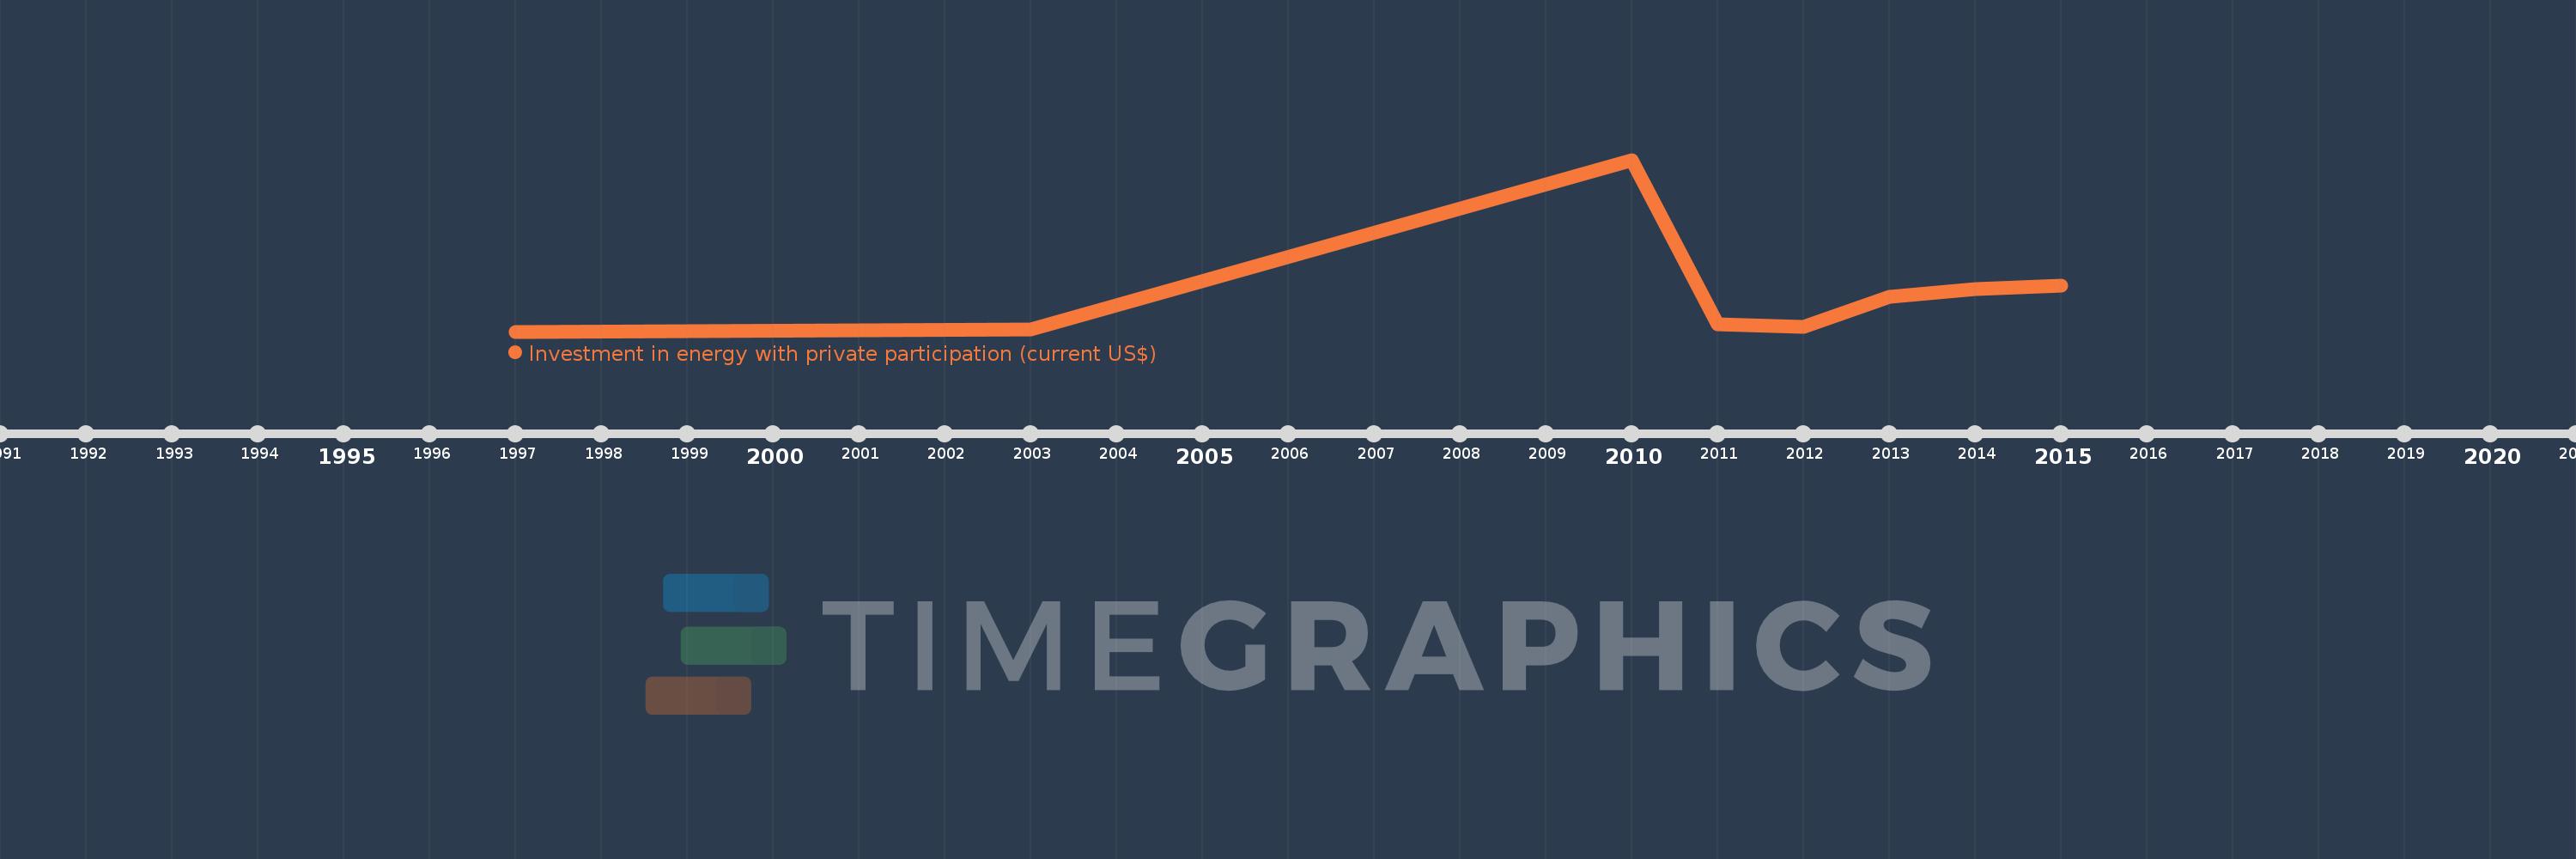
Investment in energy with private participation (current US$)
2015,2014,2013,2012,2011,2010,2003,1997
This statistics in other country:
Timeline:
This timeline shows a graph from 1997 to 2015 of Albania. No data until 1996. Number of actual observations by date: 8.
Source name:
World Development Indicators
Source organization:
World Bank, Private Participation in Infrastructure Project Database (http://ppi.worldbank.org).
Categories, topics:
Energy & Mining, Infrastructure, Private Sector
Last updated:
apr 23, 2017
Indicators value changes by year
Maximum:
664.0 mln
jan 1, 2010
At the date of observation
Value
Absolute change
Change from previous value
jan 1, 2003
8.0 mln
+8.0 mln
%
jan 1, 2010
664.0 mln
+656.0 mln
8.2K%
jan 1, 2011
28.0 mln
-636.0 mln
-95.78%
jan 1, 2012
19.56 mln
-8.44 mln
-30.14%
jan 1, 2013
134.4 mln
+114.84 mln
587.12%
jan 1, 2014
164.0 mln
+29.6 mln
22.02%
jan 1, 2015
177.0 mln
+13.0 mln
7.93%
Ranking of countries by current statistics by years


Comments: