29
/
en
AIzaSyAYiBZKx7MnpbEhh9jyipgxe19OcubqV5w
April 1, 2024
235969
Senegal
SEN
true
2
1
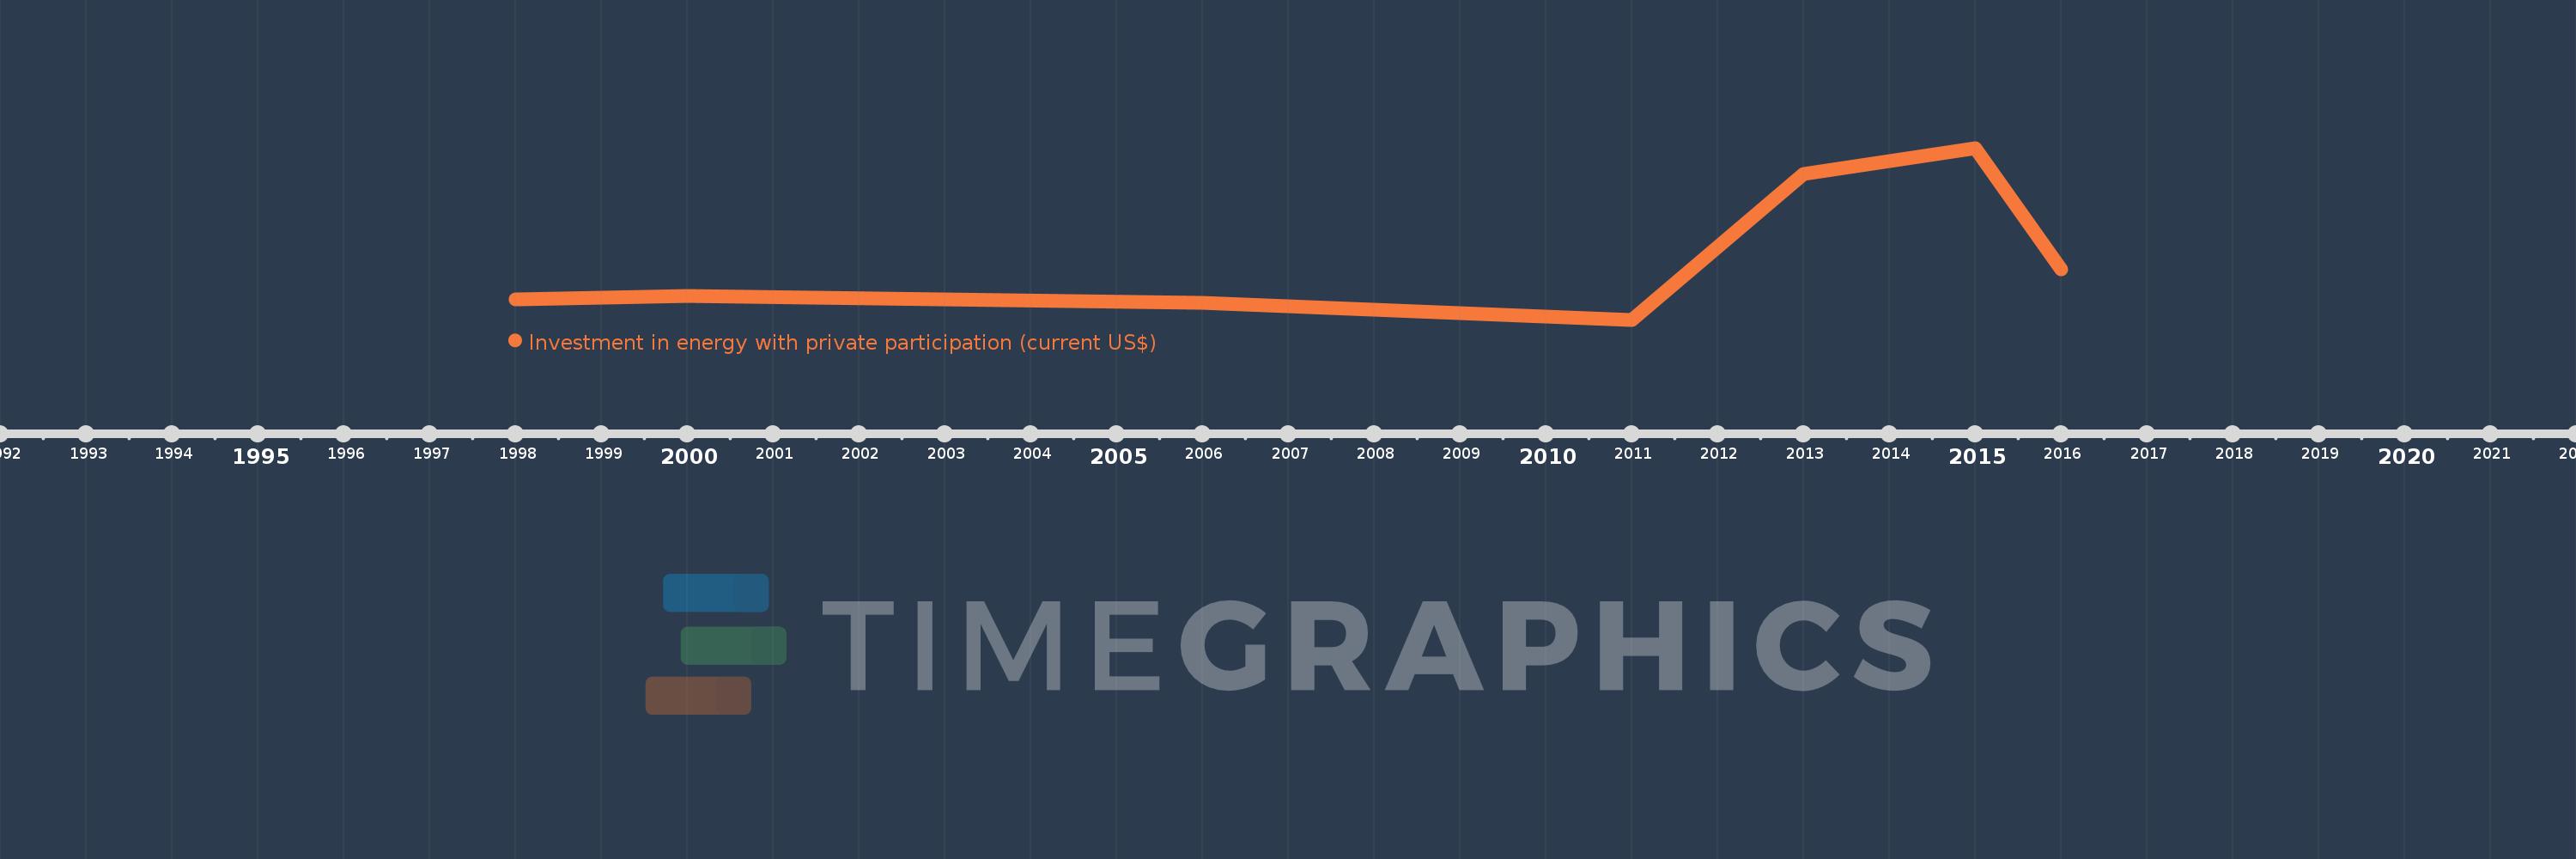
Investment in energy with private participation (current US$)
2016,2015,2013,2011,2006,2000,1998
This statistics in other country:
Timeline:
This timeline shows a graph from 1998 to 2016 of Senegal. No data until 1997. Number of actual observations by date: 7.
Source name:
World Development Indicators
Source organization:
World Bank, Private Participation in Infrastructure Project Database (http://ppi.worldbank.org).
Categories, topics:
Energy & Mining, Infrastructure, Private Sector
Last updated:
apr 23, 2017
Indicators value changes by year
Minimum:
22.0 mln
jan 1, 2011
Maximum:
336.0 mln
jan 1, 2015
At the date of observation
Value
Absolute change
Change from previous value
jan 1, 1998
59.0 mln
+59.0 mln
0.0%
jan 1, 2000
65.0 mln
+6.0 mln
10.17%
jan 1, 2006
52.91 mln
-12.09 mln
-18.6%
jan 1, 2011
22.0 mln
-30.91 mln
-58.42%
jan 1, 2013
288.0 mln
+266.0 mln
1.21K%
jan 1, 2015
336.0 mln
+48.0 mln
16.67%
jan 1, 2016
114.15 mln
-221.85 mln
-66.03%
Ranking of countries by current statistics by years


Comments: