29
/
en
AIzaSyAYiBZKx7MnpbEhh9jyipgxe19OcubqV5w
April 1, 2024
37482
IDA & IBRD total
IBT
false
2
1
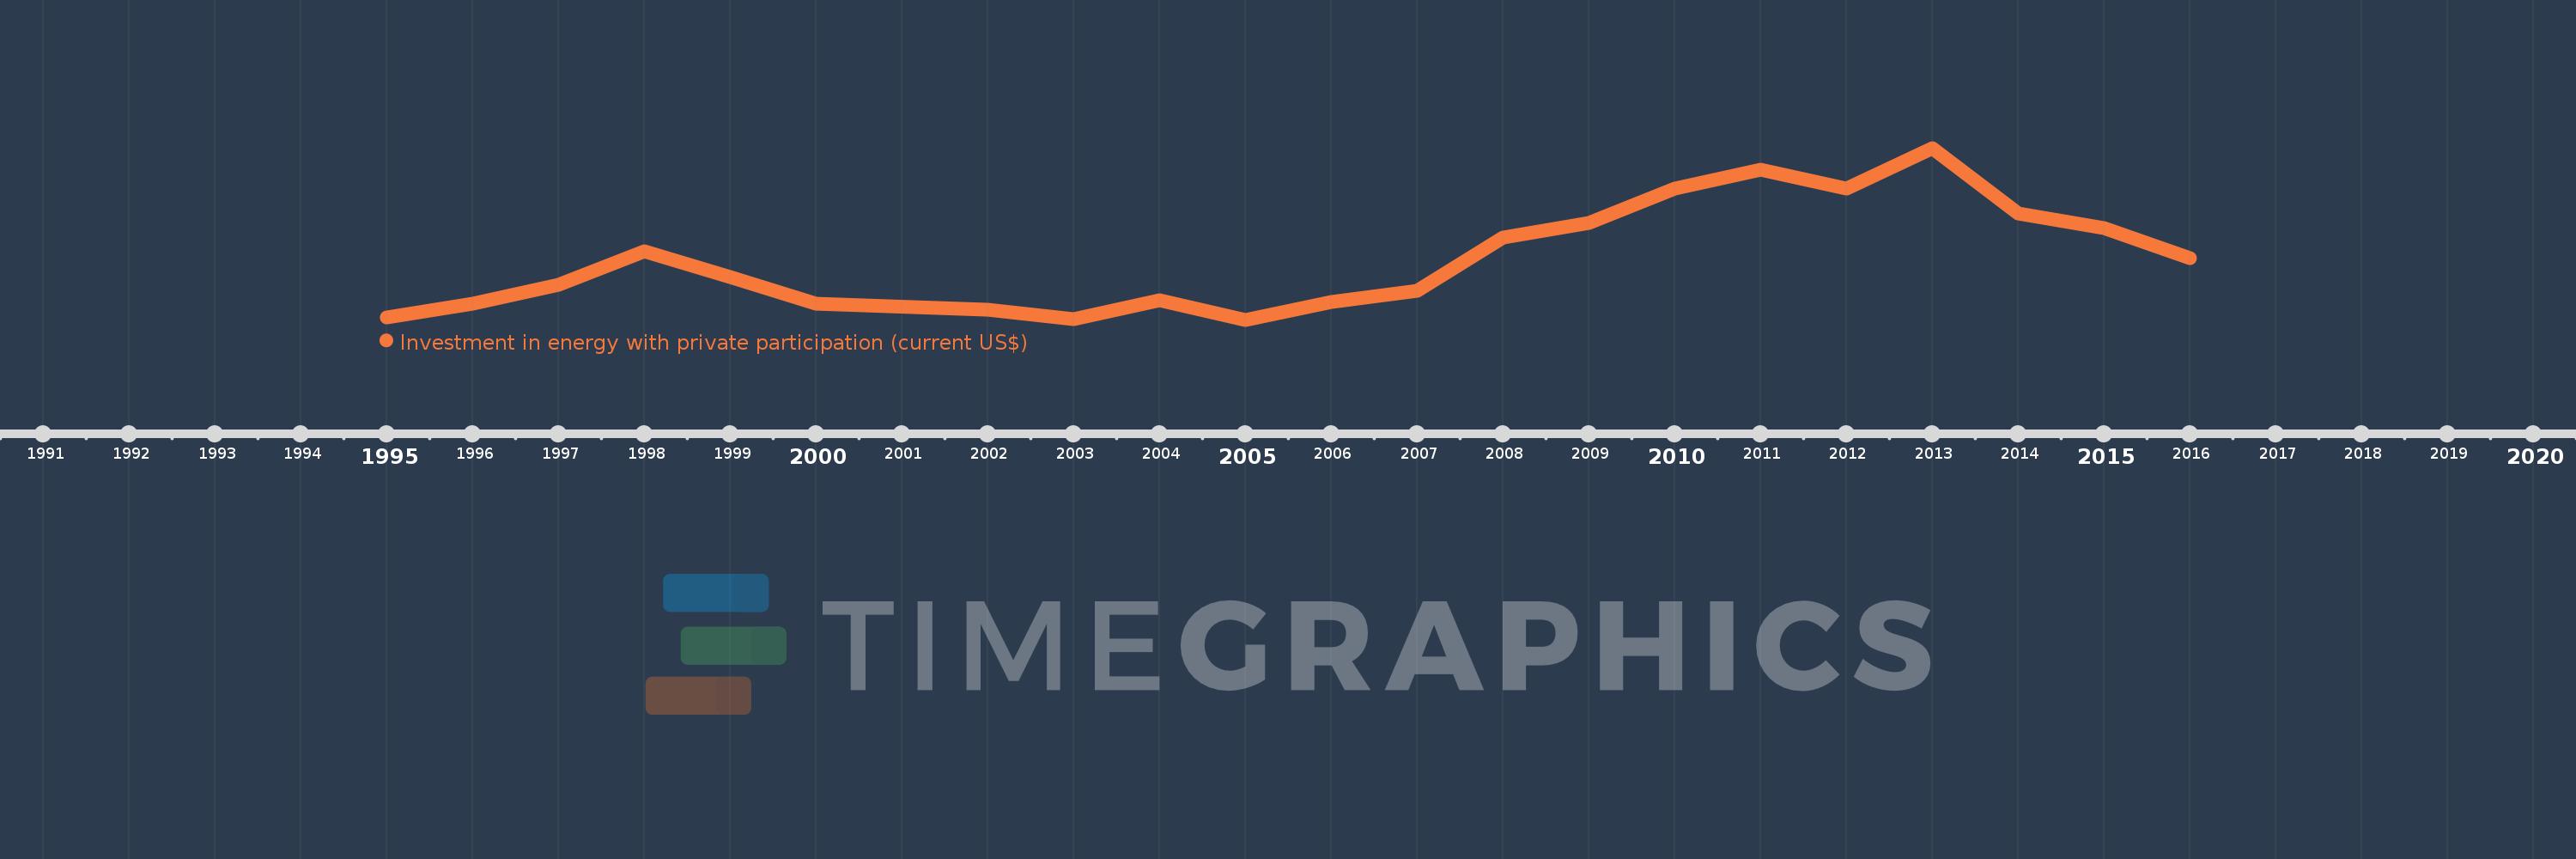
Investment in energy with private participation (current US$)
2016,2015,2014,2013,2012,2011,2010,2009,2008,2007,2006,2005,2004,2003,2002,2000,1999,1998,1997,1996,1995
This statistics in other country:
Timeline:
This timeline shows a graph from 1995 to 2016 of IDA & IBRD total. No data until 1994. Number of actual observations by date: 21.
Source name:
World Development Indicators
Source organization:
World Bank, Private Participation in Infrastructure Project Database (http://ppi.worldbank.org).
Categories, topics:
Energy & Mining, Infrastructure, Private Sector
Last updated:
apr 23, 2017
Indicators value changes by year
Minimum:
12.628 bln
jan 1, 2005
Maximum:
90.72 bln
jan 1, 2013
At the date of observation
Value
Absolute change
Change from previous value
jan 1, 1995
13.814 bln
+13.814 bln
0.0%
jan 1, 1996
19.882 bln
+6.068 bln
43.93%
jan 1, 1997
28.634 bln
+8.752 bln
44.02%
jan 1, 1998
43.709 bln
+15.075 bln
52.65%
jan 1, 1999
32.136 bln
-11.573 bln
-26.48%
jan 1, 2000
19.762 bln
-12.374 bln
-38.5%
jan 1, 2002
17.337 bln
-2.426 bln
-12.27%
jan 1, 2003
12.778 bln
-4.559 bln
-26.3%
jan 1, 2004
21.541 bln
+8.763 bln
68.58%
jan 1, 2005
12.628 bln
-8.913 bln
-41.38%
jan 1, 2006
20.53 bln
+7.902 bln
62.58%
jan 1, 2007
25.833 bln
+5.303 bln
25.83%
jan 1, 2008
49.849 bln
+24.016 bln
92.96%
jan 1, 2009
56.672 bln
+6.823 bln
13.69%
jan 1, 2010
72.381 bln
+15.708 bln
27.72%
jan 1, 2011
80.728 bln
+8.348 bln
11.53%
jan 1, 2012
72.154 bln
-8.574 bln
-10.62%
jan 1, 2013
90.72 bln
+18.566 bln
25.73%
jan 1, 2014
60.895 bln
-29.825 bln
-32.88%
jan 1, 2015
54.484 bln
-6.411 bln
-10.53%
jan 1, 2016
40.599 bln
-13.885 bln
-25.48%
Ranking of countries by current statistics by years


Comments: