29
/
en
AIzaSyAYiBZKx7MnpbEhh9jyipgxe19OcubqV5w
April 1, 2024
204264
Myanmar
MMR
true
2
1
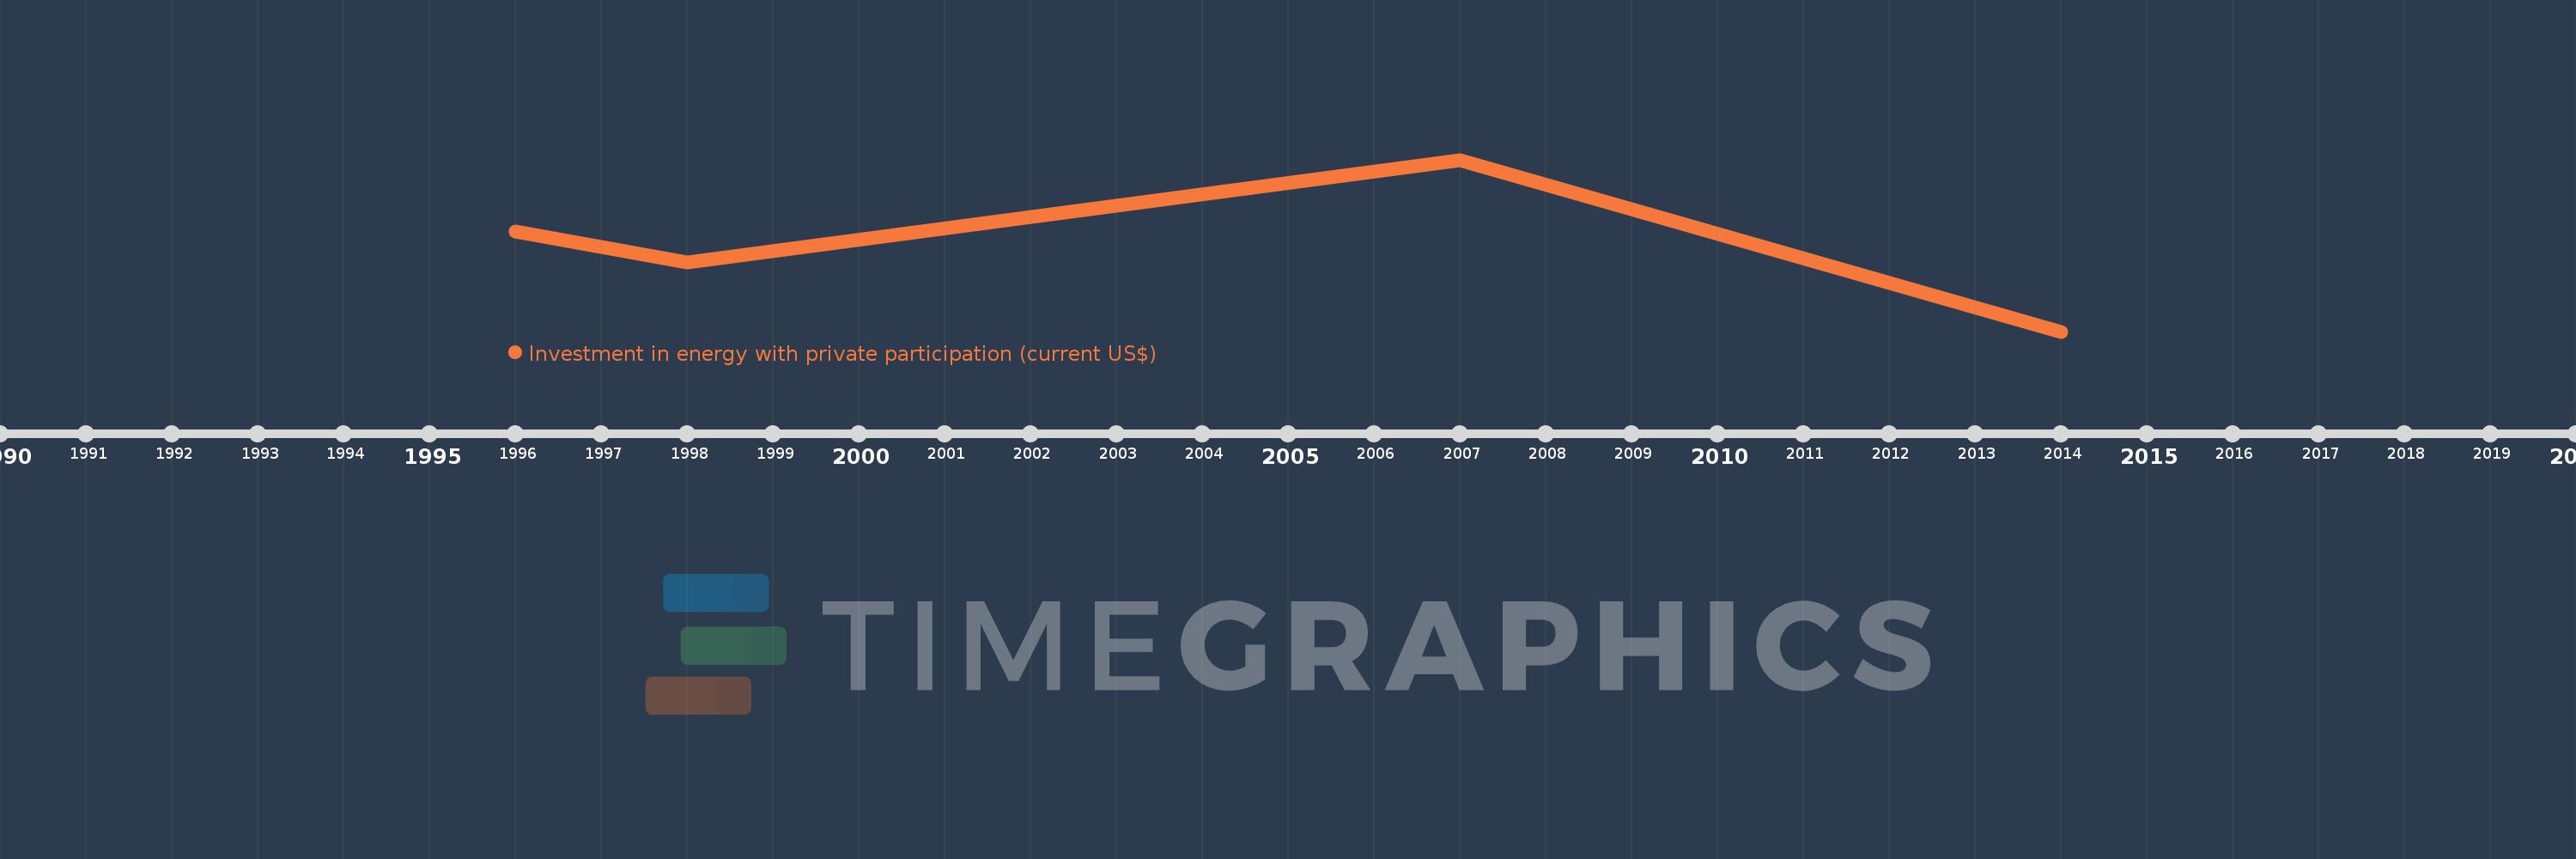
Investment in energy with private participation (current US$)
2014,2007,1998,1996
This statistics in other country:
Timeline:
This timeline shows a graph from 1996 to 2014 of Myanmar. No data until 1995. Number of actual observations by date: 4.
Source name:
World Development Indicators
Source organization:
World Bank, Private Participation in Infrastructure Project Database (http://ppi.worldbank.org).
Categories, topics:
Energy & Mining, Infrastructure, Private Sector
Last updated:
apr 23, 2017
Indicators value changes by year
Minimum:
170.0 mln
jan 1, 2014
Maximum:
556.1 mln
jan 1, 2007
At the date of observation
Value
Absolute change
Change from previous value
jan 1, 1996
394.0 mln
+394.0 mln
0.0%
jan 1, 1998
325.0 mln
-69.0 mln
-17.51%
jan 1, 2007
556.1 mln
+231.1 mln
71.11%
jan 1, 2014
170.0 mln
-386.1 mln
-69.43%
Ranking of countries by current statistics by years


Comments: