29
/
en
AIzaSyAYiBZKx7MnpbEhh9jyipgxe19OcubqV5w
April 1, 2024
122325
Dominican Republic
DOM
true
2
1
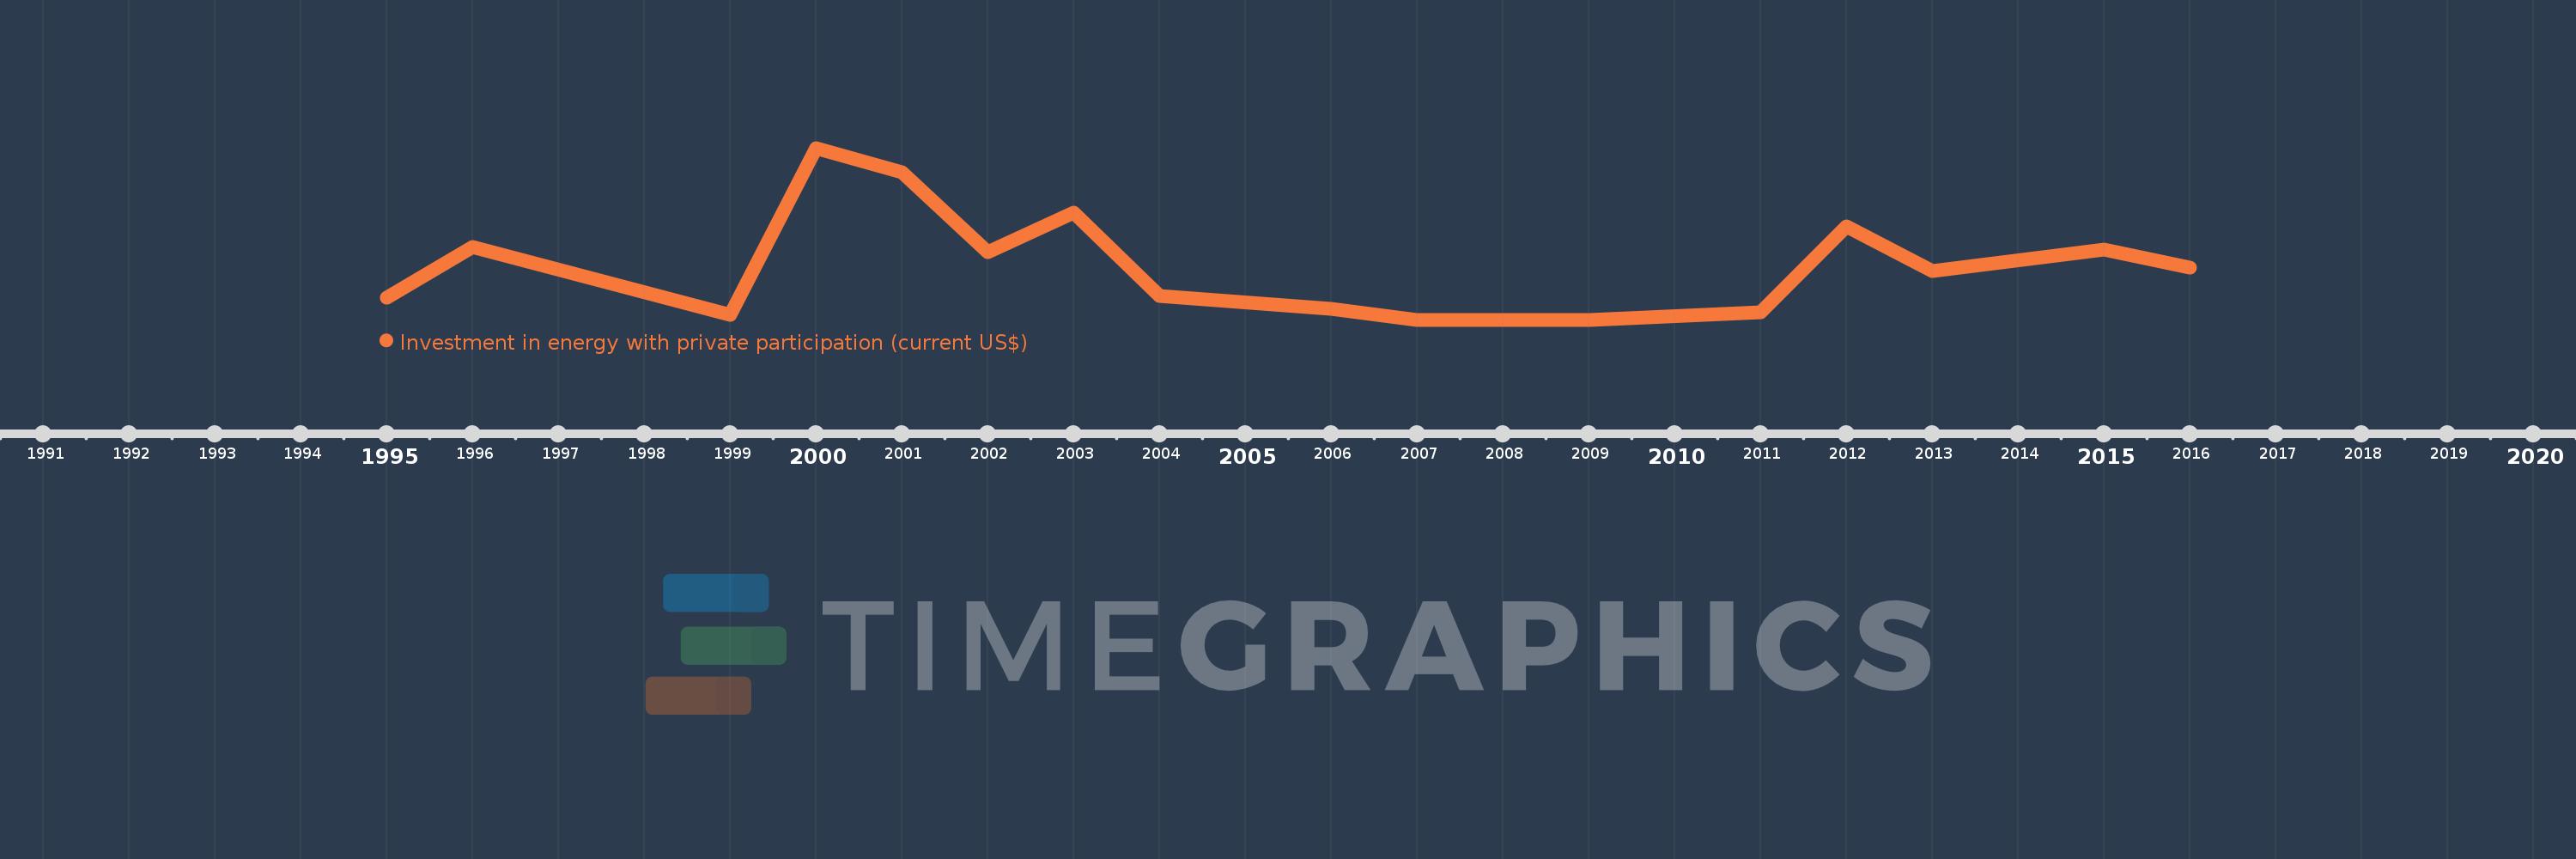
Investment in energy with private participation (current US$)
2016,2015,2013,2012,2011,2009,2007,2006,2004,2003,2002,2001,2000,1999,1996,1995
This statistics in other country:
Timeline:
This timeline shows a graph from 1995 to 2016 of Dominican Republic. No data until 1994. Number of actual observations by date: 16.
Source name:
World Development Indicators
Source organization:
World Bank, Private Participation in Infrastructure Project Database (http://ppi.worldbank.org).
Categories, topics:
Energy & Mining, Infrastructure, Private Sector
Last updated:
apr 23, 2017
Indicators value changes by year
Maximum:
674.0 mln
jan 1, 2000
At the date of observation
Value
Absolute change
Change from previous value
jan 1, 1995
87.5 mln
+87.5 mln
0.0%
jan 1, 1996
285.0 mln
+197.5 mln
225.71%
jan 1, 1999
20.0 mln
-265.0 mln
-92.98%
jan 1, 2000
674.0 mln
+654.0 mln
3.27K%
jan 1, 2001
577.3 mln
-96.7 mln
-14.35%
jan 1, 2002
265.0 mln
-312.3 mln
-54.1%
jan 1, 2003
421.8 mln
+156.8 mln
59.17%
jan 1, 2004
95.0 mln
-326.8 mln
-77.48%
jan 1, 2006
42.5 mln
-52.5 mln
-55.26%
jan 1, 2007
0.0
-42.5 mln
-100.0%
jan 1, 2011
30.0 mln
+30.0 mln
%
jan 1, 2012
365.7 mln
+335.7 mln
1.12K%
jan 1, 2013
190.0 mln
-175.7 mln
-48.04%
jan 1, 2015
277.0 mln
+87.0 mln
45.79%
jan 1, 2016
204.5 mln
-72.5 mln
-26.17%
Ranking of countries by current statistics by years


Comments: