30
/
AIzaSyAYiBZKx7MnpbEhh9jyipgxe19OcubqV5w
April 1, 2024
231238
Rwanda
RWA
true
2
1
Investment in energy with private participation (current US$)
2016,2015,2013,2012,2011,2008,2006,2004
Public Timelines
FAQ
Menu
Public Timelines
FAQ
Public Timelines
FAQ
For education
For educational institutions
For teachers
For students
Open cabinet
For educational institutions
For teachers
For students
Open cabinet
Create
Close
Create a timeline
Public timelines
Library
FAQ
Download
Global statistics library
→
Rwanda
→
Investment in energy with private participation (current US$)
This statistics in other country:
Afghanistan
Albania
Algeria
Angola
Argentina
Armenia
Azerbaijan
Bangladesh
Belarus
Belize
Benin
Bhutan
Bolivia
Bosnia and Herzegovina
Botswana
Brazil
Bulgaria
Burkina Faso
Cabo Verde
Cambodia
Cameroon
Chad
Chile
China
Colombia
Comoros
Congo, Rep.
Costa Rica
Cote d'Ivoire
Cuba
Dominica
Dominican Republic
Early-demographic dividend
East Asia & Pacific (excluding high income)
East Asia & Pacific (IDA & IBRD countries)
Ecuador
Egypt, Arab Rep.
El Salvador
Ethiopia
Europe & Central Asia (excluding high income)
Europe & Central Asia (IDA & IBRD countries)
Fiji
Gabon
Gambia, The
Georgia
Ghana
Grenada
Guatemala
Guinea
Guinea-Bissau
Guyana
Haiti
Honduras
IBRD only
IDA & IBRD total
IDA blend
India
Indonesia
Iran, Islamic Rep.
Iraq
Jamaica
Jordan
Kazakhstan
Kenya
Kosovo
Kyrgyz Republic
Lao PDR
Late-demographic dividend
Latin America & Caribbean
Latin America & Caribbean (excluding high income)
Latin America & the Caribbean (IDA & IBRD countries)
Lesotho
Liberia
Lithuania
Low & middle income
Lower middle income
Macedonia, FYR
Madagascar
Malawi
Malaysia
Mali
Mauritius
Mexico
Middle income
Moldova
Mongolia
Montenegro
Morocco
Mozambique
Myanmar
Namibia
Nepal
Nicaragua
Nigeria
Pakistan
Panama
Papua New Guinea
Peru
Philippines
Romania
Russian Federation
Rwanda
Sao Tome and Principe
Senegal
Serbia
Sierra Leone
Solomon Islands
South Africa
South Asia
South Asia (IDA & IBRD)
Sri Lanka
St. Kitts and Nevis
St. Lucia
Tajikistan
Tanzania
Thailand
Timor-Leste
Togo
Tonga
Tunisia
Turkey
Uganda
Ukraine
Upper middle income
Uruguay
Vanuatu
Venezuela, RB
Vietnam
West Bank and Gaza
Yemen, Rep.
Zambia
Zimbabwe
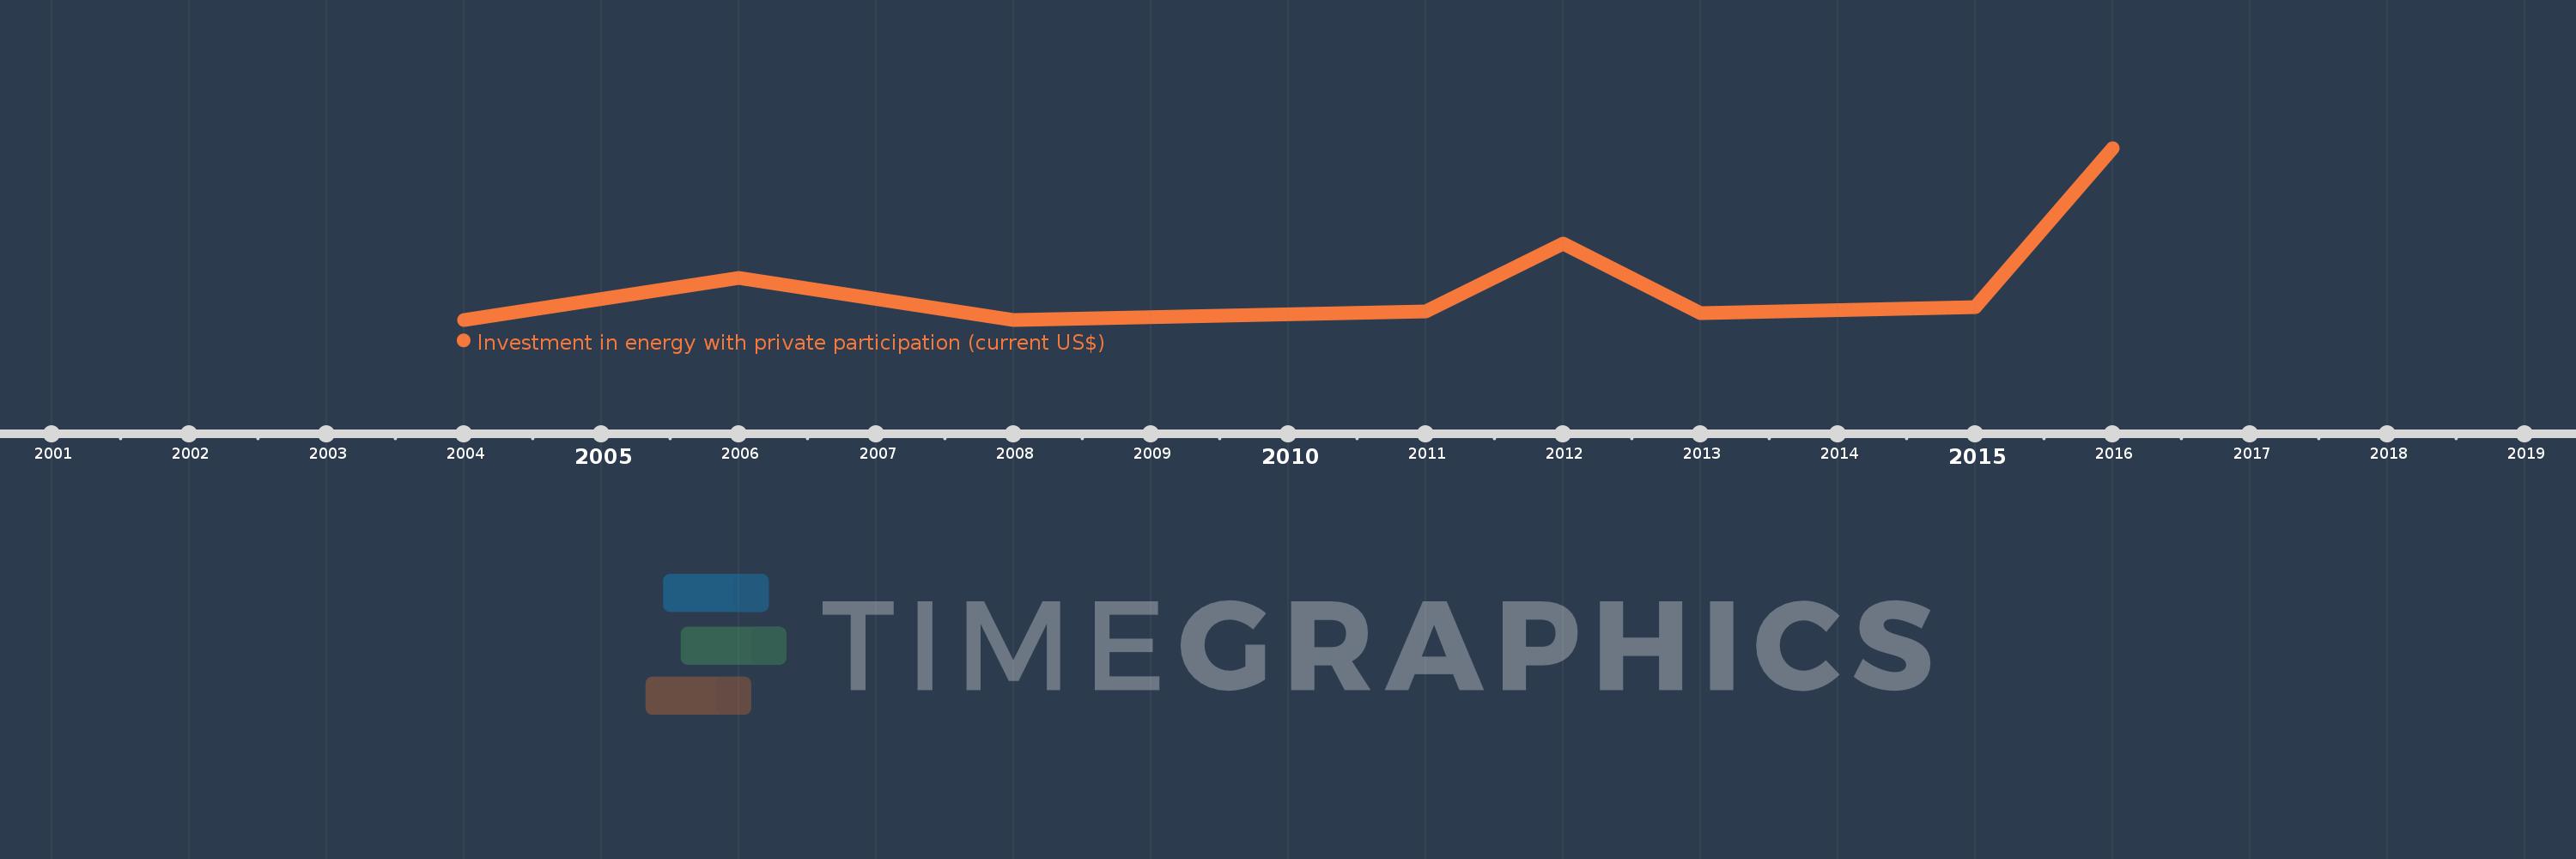
Timeline:
This timeline shows a graph from
2004
to
2016
of Rwanda. No data until
2003
. Number of actual observations by date:
8
.
Source name:
World Development Indicators
Source organization:
World Bank, Private Participation in Infrastructure Project Database (http://ppi.worldbank.org).
Categories, topics:
Energy & Mining, Infrastructure, Private Sector
Last updated:
apr 23, 2017
Indicators value changes by year
Meaning:
73.96 mln
Minimum:
0.0
jan 1, 2004
Maximum:
320.0 mln
jan 1, 2016
At the date of observation
Value
Absolute change
Change from the previous value
jan 1, 2004
0.0
0.0
0.0%
jan 1, 2006
77.58 mln
+77.58 mln
%
jan 1, 2008
0.0
-77.58 mln
-100.0%
jan 1, 2011
16.0 mln
+16.0 mln
%
jan 1, 2012
142.0 mln
+126.0 mln
787.5%
jan 1, 2013
12.0 mln
-130.0 mln
-91.55%
jan 1, 2015
24.1 mln
+12.1 mln
100.83%
jan 1, 2016
320.0 mln
+295.9 mln
1.23K%
Ranking of countries by current statistics by years
About & Feedback
Terms
Privacy
Library
2024
©
Time.Graphics
Support 24/7
Cabinet
Get premium
Donate
The service accepts bank transfer (ACH, Wire) or cards (Visa, MasterCard, etc). Processed by Stripe.
Secured with SSL
Excellent (Trustpilot Reviews)
Based on 115+ reviews
Write your own review on
Trustpilot.com
