29
/
en
AIzaSyAYiBZKx7MnpbEhh9jyipgxe19OcubqV5w
April 1, 2024
273779
Ukraine
UKR
true
2
1
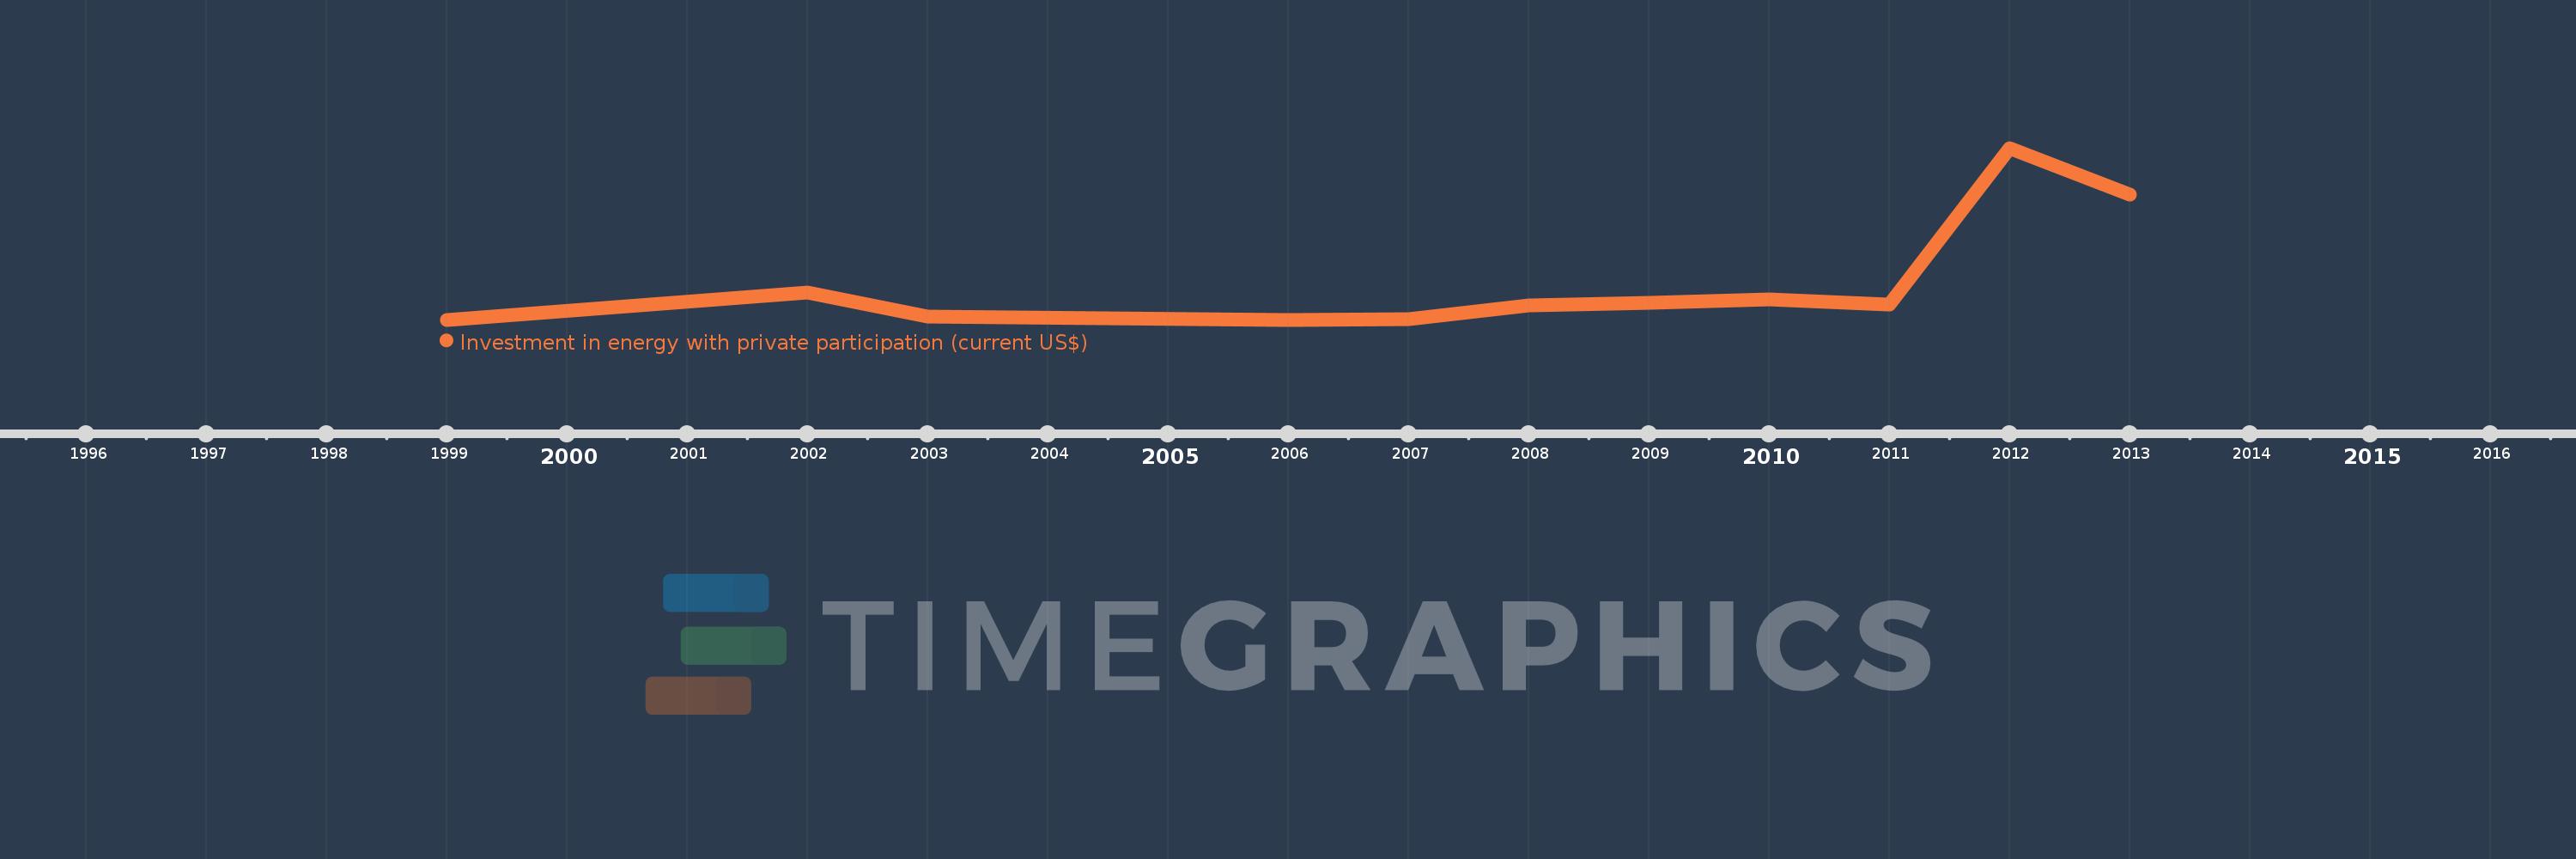
Investment in energy with private participation (current US$)
2013,2012,2011,2010,2009,2008,2007,2006,2003,2002,1999
This statistics in other country:
Timeline:
This timeline shows a graph from 1999 to 2013 of Ukraine. No data until 1998. Number of actual observations by date: 11.
Source name:
World Development Indicators
Source organization:
World Bank, Private Participation in Infrastructure Project Database (http://ppi.worldbank.org).
Categories, topics:
Energy & Mining, Infrastructure, Private Sector
Last updated:
apr 23, 2017
Indicators value changes by year
Maximum:
997.8 mln
jan 1, 2012
At the date of observation
Value
Absolute change
Change from previous value
jan 1, 2002
160.0 mln
+160.0 mln
%
jan 1, 2003
20.0 mln
-140.0 mln
-87.5%
jan 1, 2006
0.0
-20.0 mln
-100.0%
jan 1, 2007
3.9 mln
+3.9 mln
%
jan 1, 2008
83.4 mln
+79.5 mln
2.04K%
jan 1, 2009
100.14 mln
+16.74 mln
20.07%
jan 1, 2010
120.69 mln
+20.55 mln
20.52%
jan 1, 2011
88.91 mln
-31.78 mln
-26.33%
jan 1, 2012
997.8 mln
+908.89 mln
1.02K%
jan 1, 2013
724.5 mln
-273.3 mln
-27.39%
Ranking of countries by current statistics by years


Comments: