29
/it/
it
AIzaSyAYiBZKx7MnpbEhh9jyipgxe19OcubqV5w
April 1, 2024
150574
Honduras
HND
true
2
1
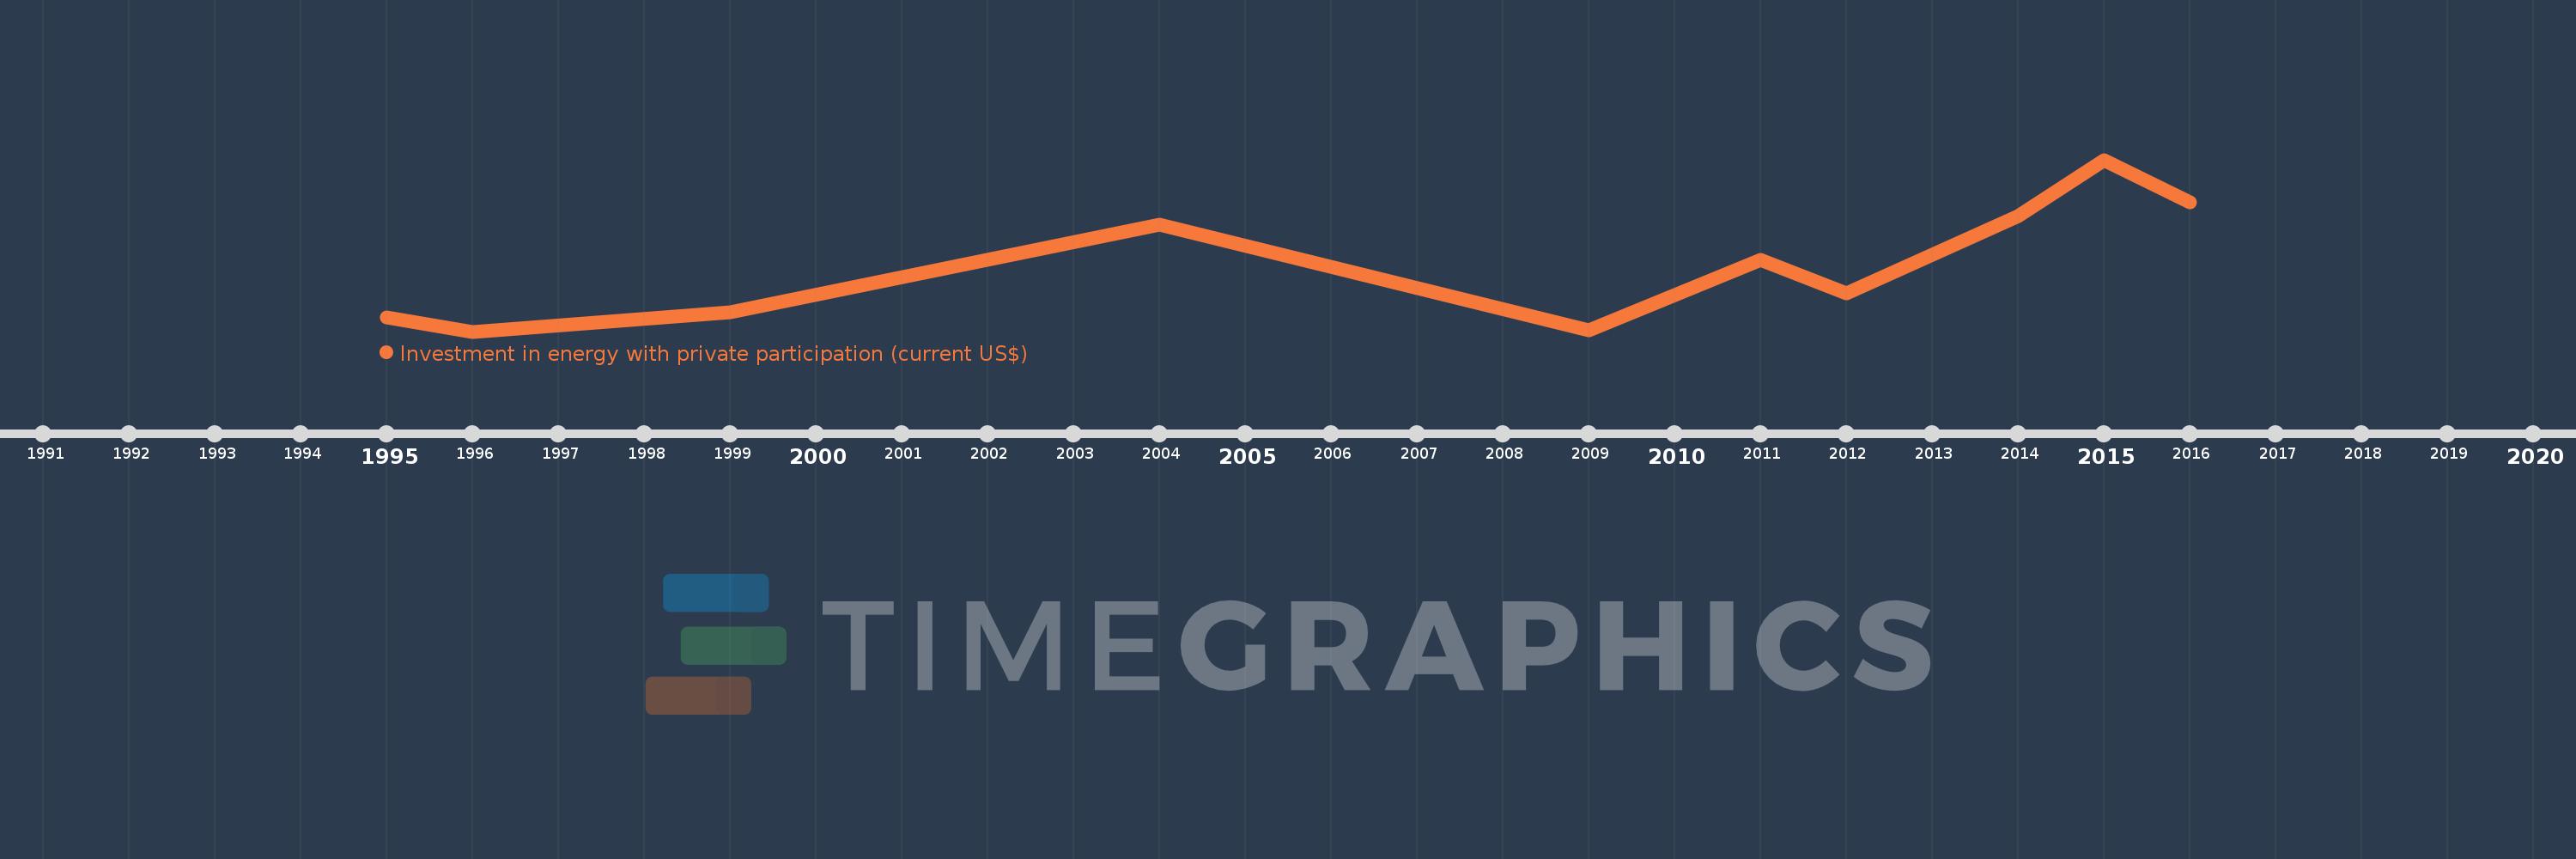
Investment in energy with private participation (current US$)
2016,2015,2014,2012,2011,2009,2004,1999,1996,1995
Queste statistiche in altri paesi:
Linea del tempo:
Questa scala temporale mostra un grafico dal 1995 anno al 2016 anno. Honduras. I dati fino ad 1994 anno non disponibili. Il numero di osservazioni attuali secondo i date: 10.
La fonte (nome):
Indicatori dello sviluppo mondiale
La fonte (organizzazione):
World Bank, Private Participation in Infrastructure Project Database (http://ppi.worldbank.org).
Categorie:
Energy & Mining, Infrastructure, Private Sector
sono stati aggiornati
23 apr 2017 anni
Indicatori delle variazioni dei valori per anni
Minima:
25.3 Mln
1 gen 1996 anni
Massimo:
562.3 Mln
1 gen 2015 anni
Alla data di osservazione
Valore
Variazione assoluta
La variazione rispetto al valore precedente
1 gen 1995 anni
70.0 Mln
+70.0 Mln
0.0%
1 gen 1996 anni
25.3 Mln
-44.7 Mln
-63.86%
1 gen 1999 anni
86.8 Mln
+61.5 Mln
243.08%
1 gen 2004 anni
358.8 Mln
+272.0 Mln
313.36%
1 gen 2009 anni
30.0 Mln
-328.8 Mln
-91.64%
1 gen 2011 anni
250.0 Mln
+220.0 Mln
733.33%
1 gen 2012 anni
144.5 Mln
-105.5 Mln
-42.2%
1 gen 2014 anni
385.6 Mln
+241.1 Mln
166.85%
1 gen 2015 anni
562.3 Mln
+176.7 Mln
45.82%
1 gen 2016 anni
430.0 Mln
-132.3 Mln
-23.53%
Classificazione dei paesi secondo i statistiche attuali per anni


Commenti: