Download Queste statistiche in altri paesi:
Linea del tempo:
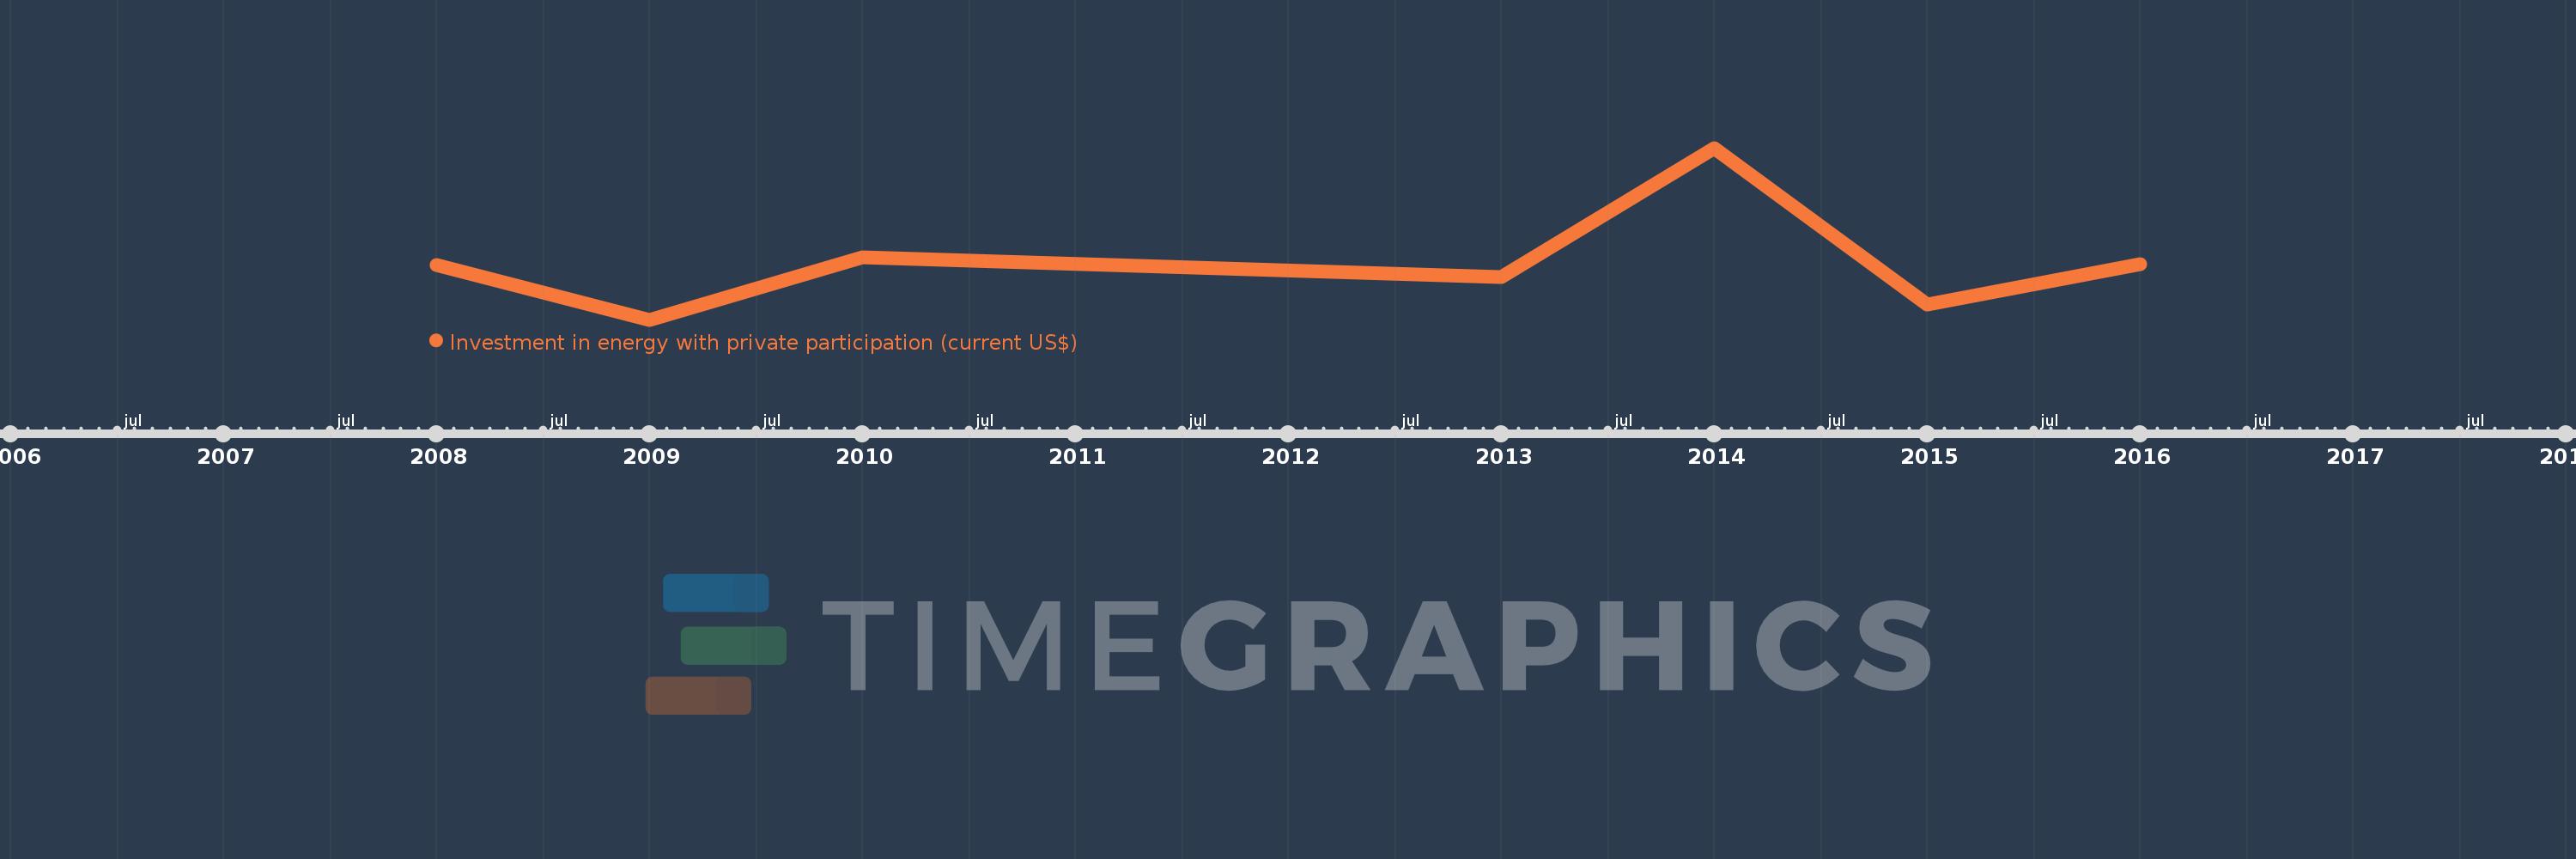
Questa scala temporale mostra un grafico dal 2008 anno al 2016 anno. Jordan. I dati fino ad 2007 anno non disponibili. Il numero di osservazioni attuali secondo i date: 7.
La fonte (nome):
Indicatori dello sviluppo mondiale
La fonte (organizzazione):
World Bank, Private Participation in Infrastructure Project Database (http://ppi.worldbank.org).
Categorie:
Energy & Mining, Infrastructure, Private Sector
sono stati aggiornati
23 apr 2017 anni
Indicatori delle variazioni dei valori per anni
Minima:
104.0 Mln
1 gen 2009 anni
Massimo:
1.102 Mlrd
1 gen 2014 anni
Alla data di osservazione
Valore
Variazione assoluta
La variazione rispetto al valore precedente
1 gen 2008 anni
420.0 Mln
+420.0 Mln
0.0%
1 gen 2009 anni
104.0 Mln
-316.0 Mln
-75.24%
1 gen 2010 anni
465.0 Mln
+361.0 Mln
347.12%
1 gen 2013 anni
350.0 Mln
-115.0 Mln
-24.73%
1 gen 2014 anni
1.102 Mlrd
+752.0 Mln
214.86%
1 gen 2015 anni
191.0 Mln
-911.0 Mln
-82.67%
1 gen 2016 anni
428.0 Mln
+237.0 Mln
124.08%
Classificazione dei paesi secondo i statistiche attuali per anni
