29
/it/
it
AIzaSyAYiBZKx7MnpbEhh9jyipgxe19OcubqV5w
April 1, 2024
204264
Myanmar
MMR
true
2
1
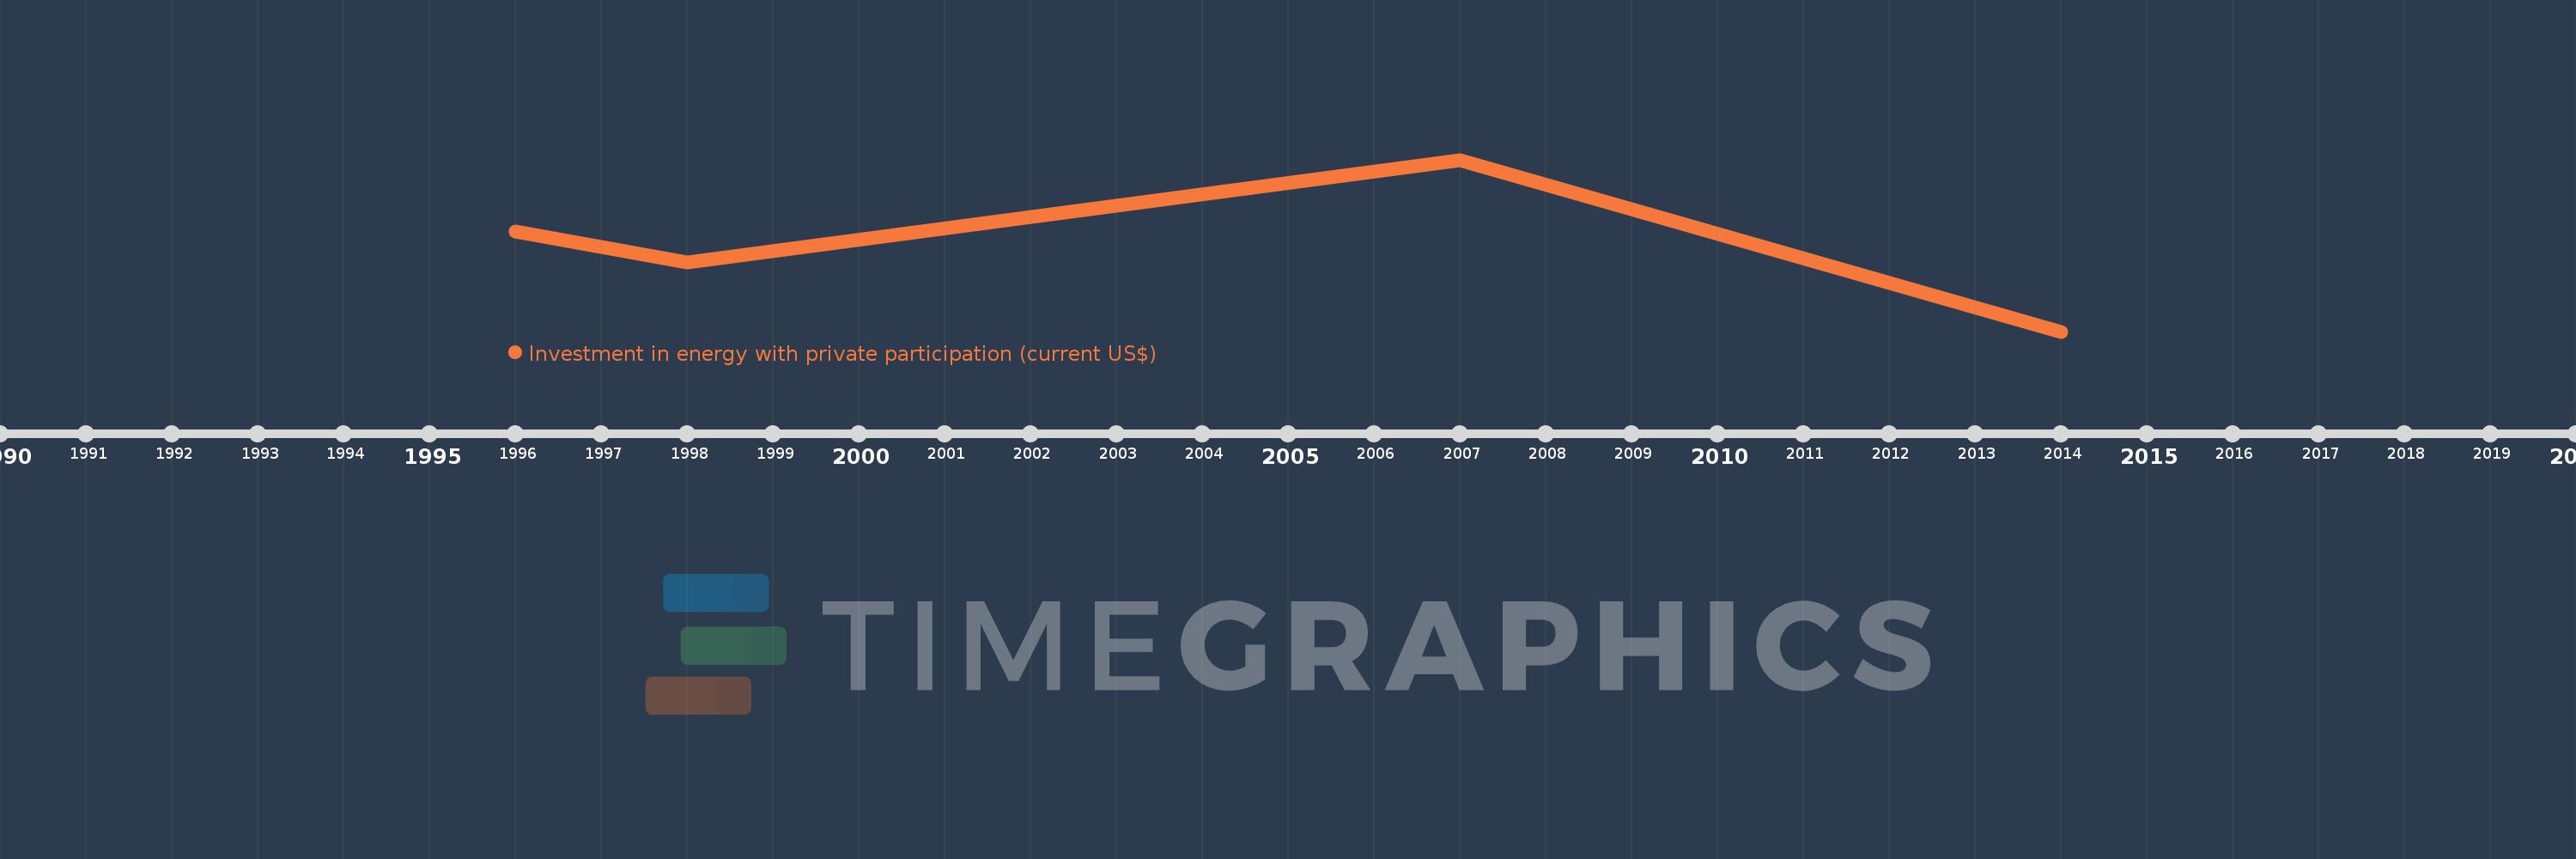
Investment in energy with private participation (current US$)
2014,2007,1998,1996
Queste statistiche in altri paesi:
Linea del tempo:
Questa scala temporale mostra un grafico dal 1996 anno al 2014 anno. Myanmar. I dati fino ad 1995 anno non disponibili. Il numero di osservazioni attuali secondo i date: 4.
La fonte (nome):
Indicatori dello sviluppo mondiale
La fonte (organizzazione):
World Bank, Private Participation in Infrastructure Project Database (http://ppi.worldbank.org).
Categorie:
Energy & Mining, Infrastructure, Private Sector
sono stati aggiornati
23 apr 2017 anni
Indicatori delle variazioni dei valori per anni
Minima:
170.0 Mln
1 gen 2014 anni
Massimo:
556.1 Mln
1 gen 2007 anni
Alla data di osservazione
Valore
Variazione assoluta
La variazione rispetto al valore precedente
1 gen 1996 anni
394.0 Mln
+394.0 Mln
0.0%
1 gen 1998 anni
325.0 Mln
-69.0 Mln
-17.51%
1 gen 2007 anni
556.1 Mln
+231.1 Mln
71.11%
1 gen 2014 anni
170.0 Mln
-386.1 Mln
-69.43%
Classificazione dei paesi secondo i statistiche attuali per anni


Commenti: