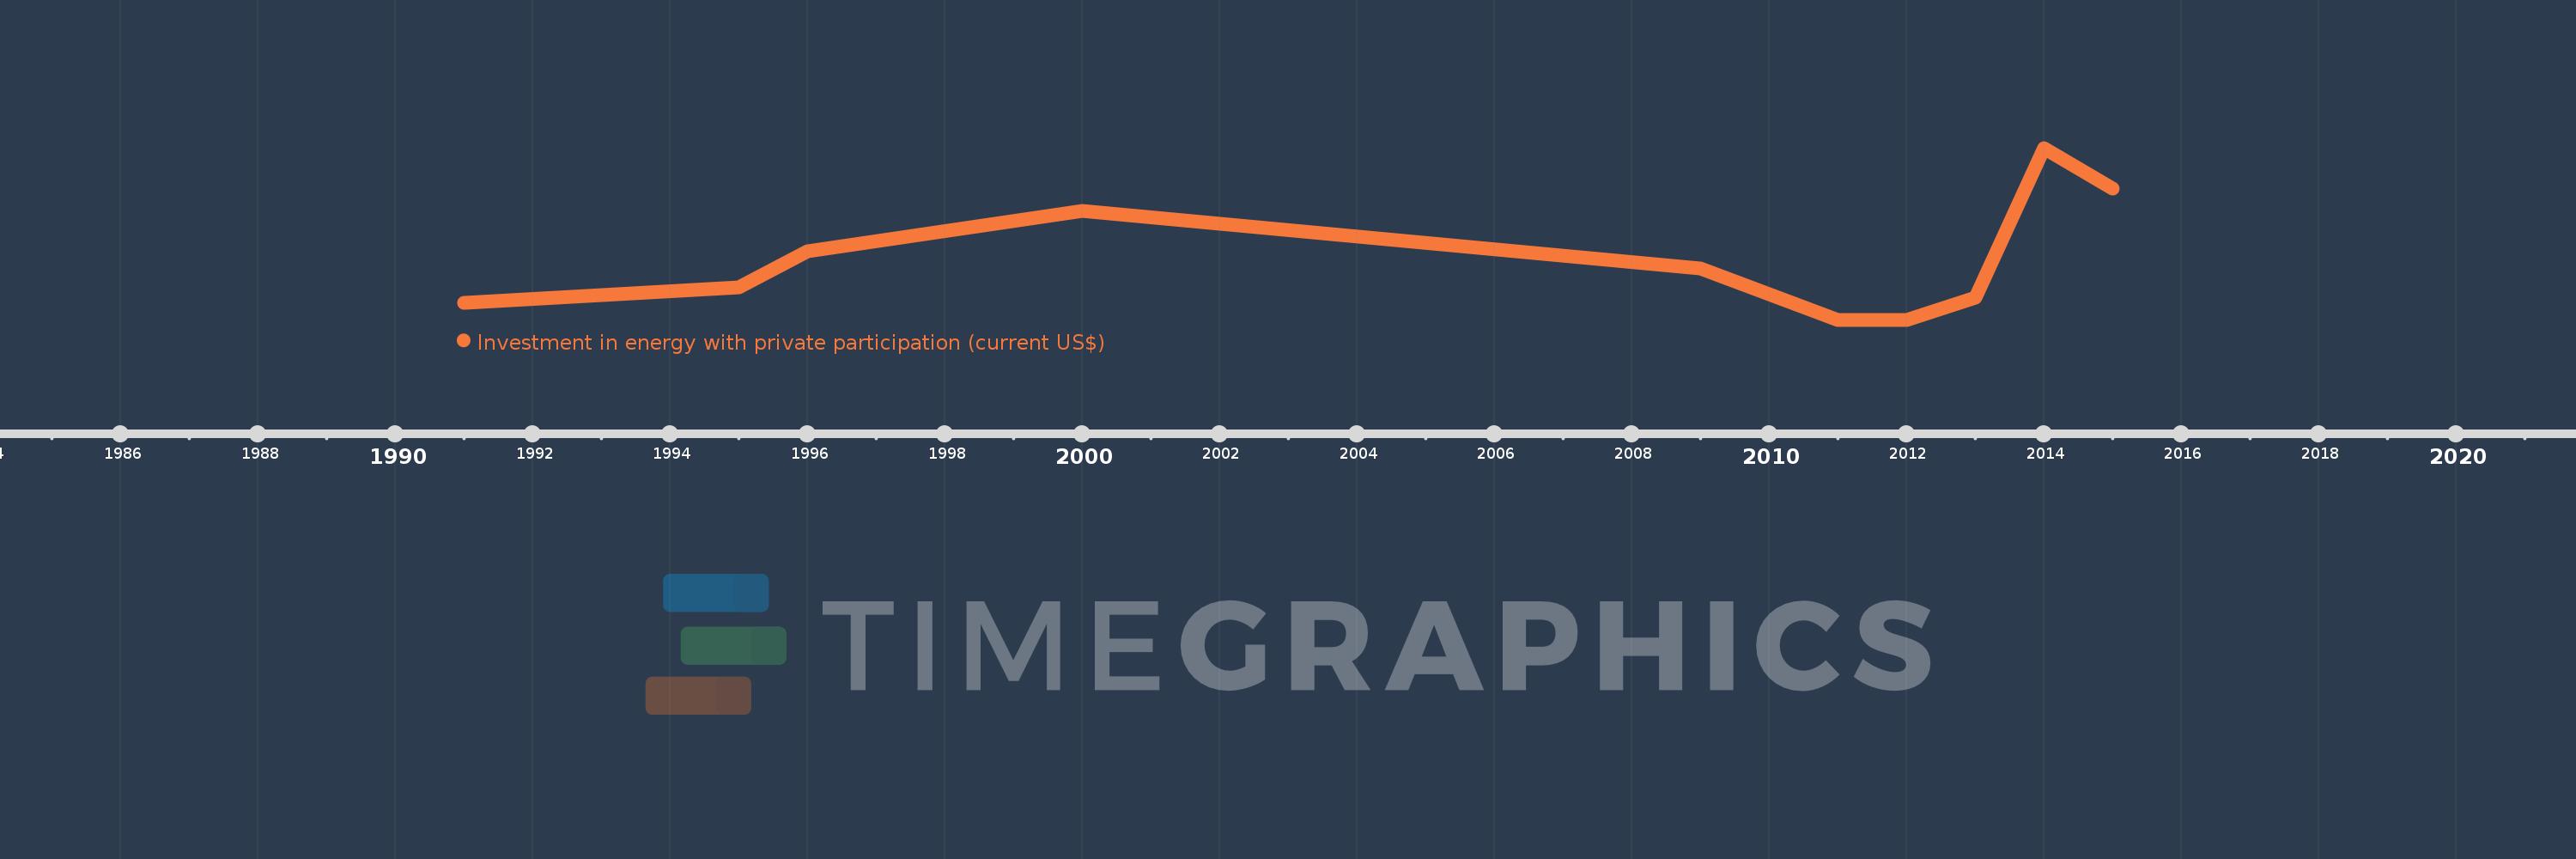
Questa scala temporale mostra un grafico dal 1991 anno al 2015 anno. Cote d'Ivoire. I dati fino ad 1990 anno non disponibili. Il numero di osservazioni attuali secondo i date: 10.
La fonte (nome):
Indicatori dello sviluppo mondiale
La fonte (organizzazione):
World Bank, Private Participation in Infrastructure Project Database (http://ppi.worldbank.org).
Categorie:
Energy & Mining, Infrastructure, Private Sector
sono stati aggiornati
23 apr 2017 anni
Indicatori delle variazioni dei valori per anni
In media:
126.38 Mln
Minima:
5.5 Mln
1 gen 2011 anni
Massimo:
350.0 Mln
1 gen 2014 anni
Alla data di osservazione
Valore
Variazione assoluta
La variazione rispetto al valore precedente
1 gen 1991 anni
39.6 Mln
+39.6 Mln
0.0%
1 gen 1995 anni
70.0 Mln
+30.4 Mln
76.77%
1 gen 1996 anni
143.2 Mln
+73.2 Mln
104.57%
1 gen 2000 anni
223.0 Mln
+79.8 Mln
55.73%
1 gen 2009 anni
108.0 Mln
-115.0 Mln
-51.57%
1 gen 2011 anni
5.5 Mln
-102.5 Mln
-94.91%
1 gen 2012 anni
5.5 Mln
0.0
0.0%
1 gen 2013 anni
50.0 Mln
+44.5 Mln
809.09%
1 gen 2014 anni
350.0 Mln
+300.0 Mln
600.0%
1 gen 2015 anni
269.0 Mln
-81.0 Mln
-23.14%
Classificazione dei paesi secondo i statistiche attuali per anni
