29
/
en
AIzaSyAYiBZKx7MnpbEhh9jyipgxe19OcubqV5w
April 1, 2024
139990
Ghana
GHA
true
2
1
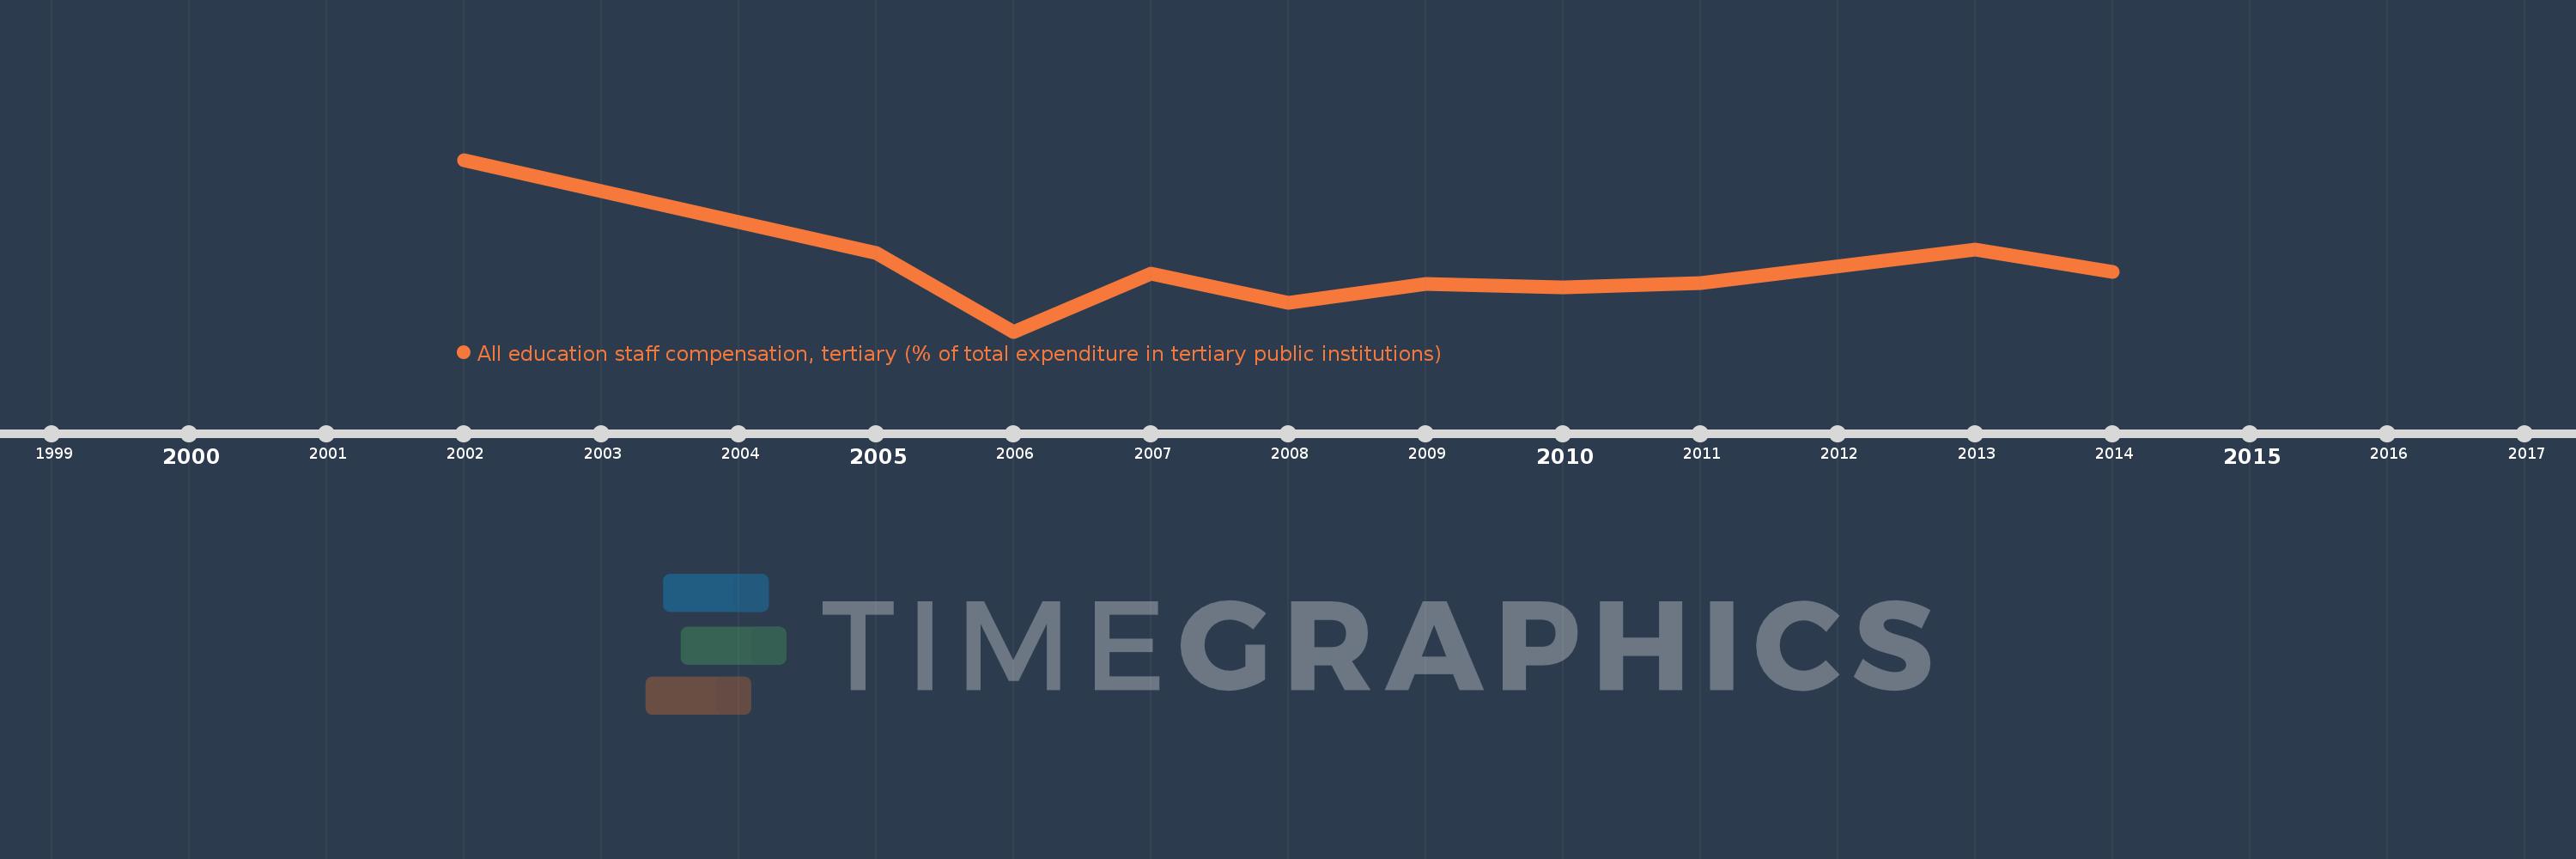
All education staff compensation, tertiary (% of total expenditure in tertiary public institutions)
2014,2013,2011,2010,2009,2008,2007,2006,2005,2002
This statistics in other country:
Timeline:
This timeline shows a graph from 2002 to 2014 of Ghana. No data until 2001. Number of actual observations by date: 10.
Source name:
World Development Indicators
Source organization:
United Nations Educational, Scientific, and Cultural Organization (UNESCO) Institute for Statistics.
Categories, topics:
Education
Last updated:
apr 23, 2017
Indicators value changes by year
Minimum:
39.641
jan 1, 2006
Maximum:
91.484
jan 1, 2002
At the date of observation
Value
Absolute change
Change from previous value
jan 1, 2002
91.484
+91.484
0.0%
jan 1, 2005
63.415
-28.069
-30.68%
jan 1, 2006
39.641
-23.774
-37.49%
jan 1, 2007
57.221
+17.58
44.35%
jan 1, 2008
48.42
-8.801
-15.38%
jan 1, 2009
53.928
+5.508
11.38%
jan 1, 2010
53.018
-0.91
-1.69%
jan 1, 2011
54.39
+1.372
2.59%
jan 1, 2013
64.396
+10.006
18.4%
jan 1, 2014
57.655
-6.741
-10.47%
Ranking of countries by current statistics by years


Comments: