29
/
en
AIzaSyAYiBZKx7MnpbEhh9jyipgxe19OcubqV5w
April 1, 2024
118649
Denmark
DNK
true
2
1
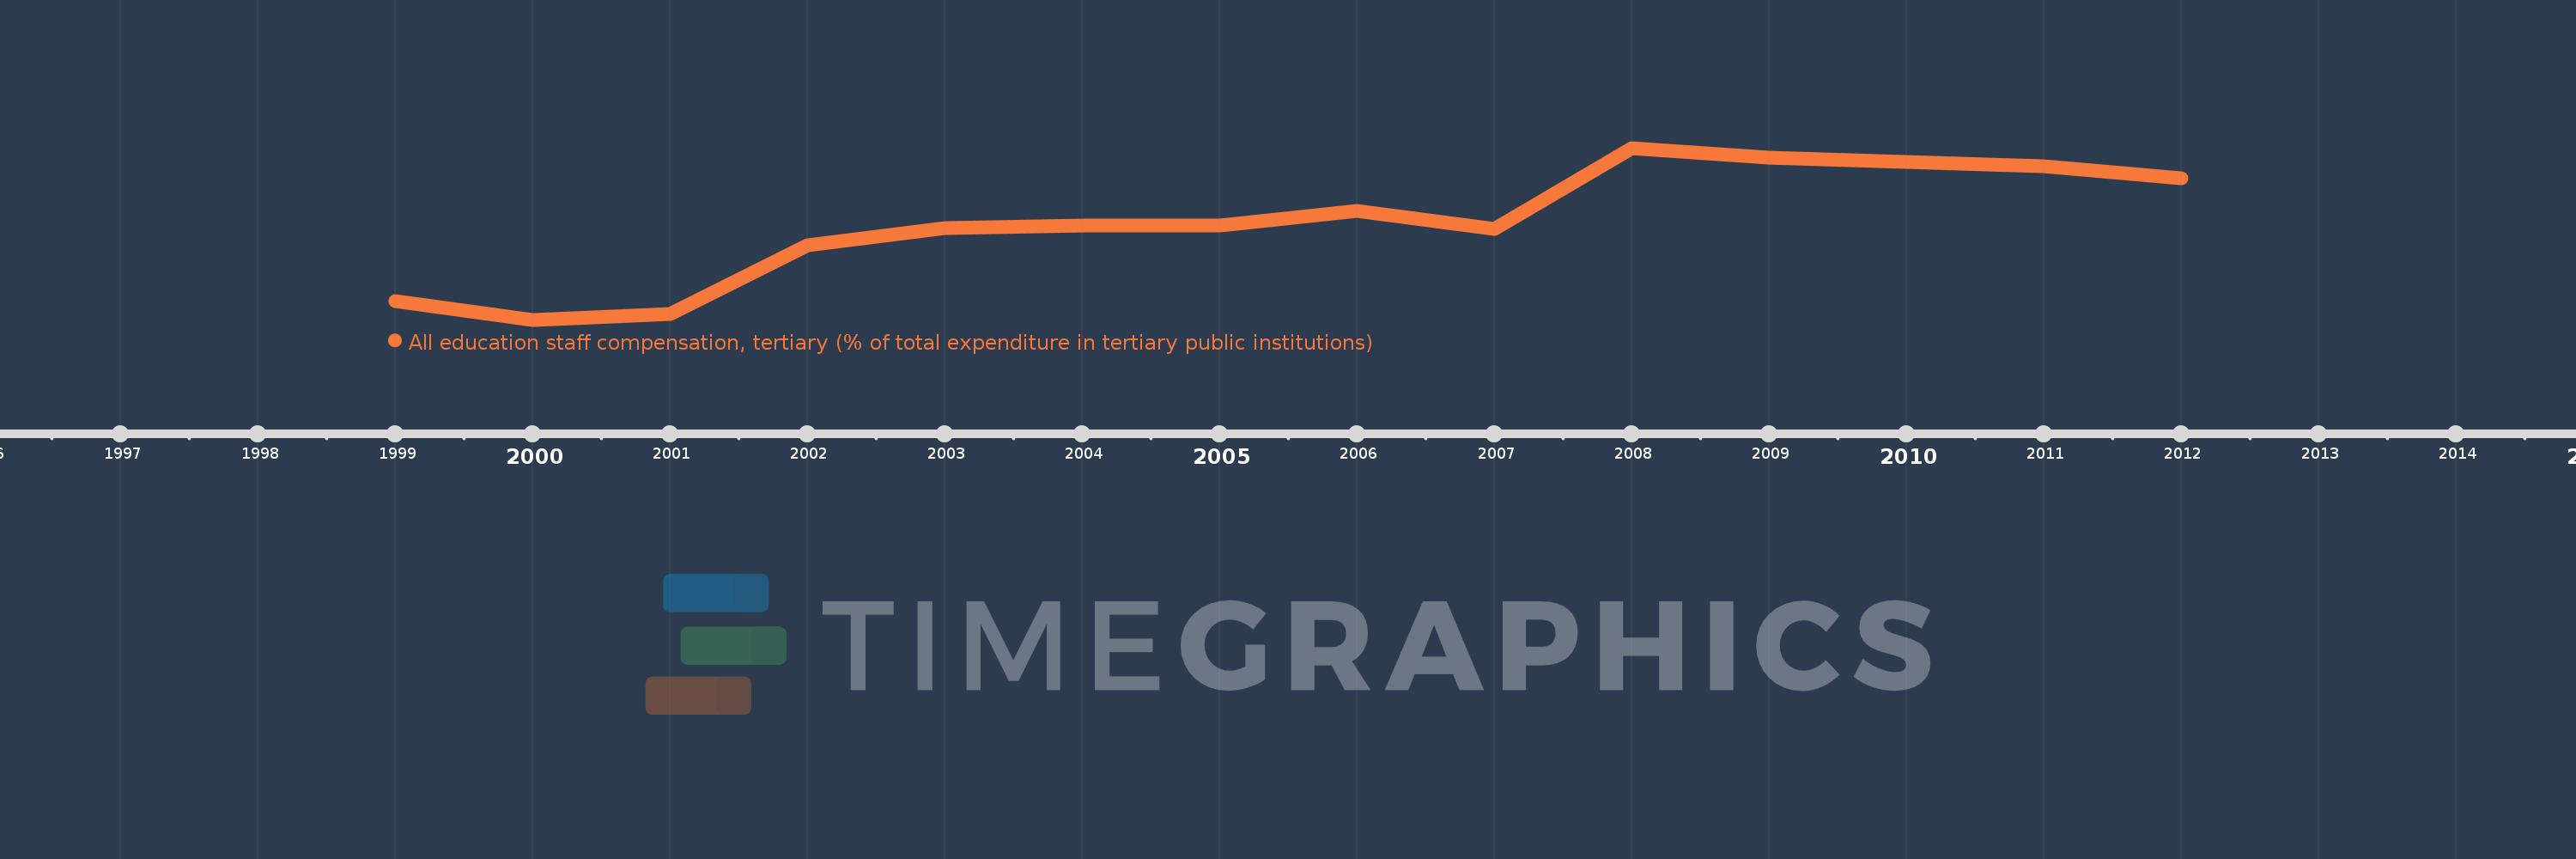
All education staff compensation, tertiary (% of total expenditure in tertiary public institutions)
2012,2011,2009,2008,2007,2006,2005,2004,2003,2002,2001,2000,1999
This statistics in other country:
Timeline:
This timeline shows a graph from 1999 to 2012 of Denmark. No data until 1998. Number of actual observations by date: 13.
Source name:
World Development Indicators
Source organization:
United Nations Educational, Scientific, and Cultural Organization (UNESCO) Institute for Statistics.
Categories, topics:
Education
Last updated:
apr 23, 2017
Indicators value changes by year
Minimum:
66.001
jan 1, 2000
Maximum:
78.733
jan 1, 2008
At the date of observation
Value
Absolute change
Change from previous value
jan 1, 1999
67.352
+67.352
0.0%
jan 1, 2000
66.001
-1.35
-2.0%
jan 1, 2001
66.425
+0.424
0.64%
jan 1, 2002
71.532
+5.107
7.69%
jan 1, 2003
72.816
+1.284
1.8%
jan 1, 2004
72.96
+0.144
0.2%
jan 1, 2005
72.985
+0.025
0.03%
jan 1, 2006
74.058
+1.072
1.47%
jan 1, 2007
72.756
-1.302
-1.76%
jan 1, 2008
78.733
+5.977
8.22%
jan 1, 2009
78.038
-0.694
-0.88%
jan 1, 2011
77.353
-0.685
-0.88%
jan 1, 2012
76.484
-0.869
-1.12%
Ranking of countries by current statistics by years


Comments: