29
/
en
AIzaSyAYiBZKx7MnpbEhh9jyipgxe19OcubqV5w
April 1, 2024
161211
Italy
ITA
true
2
1
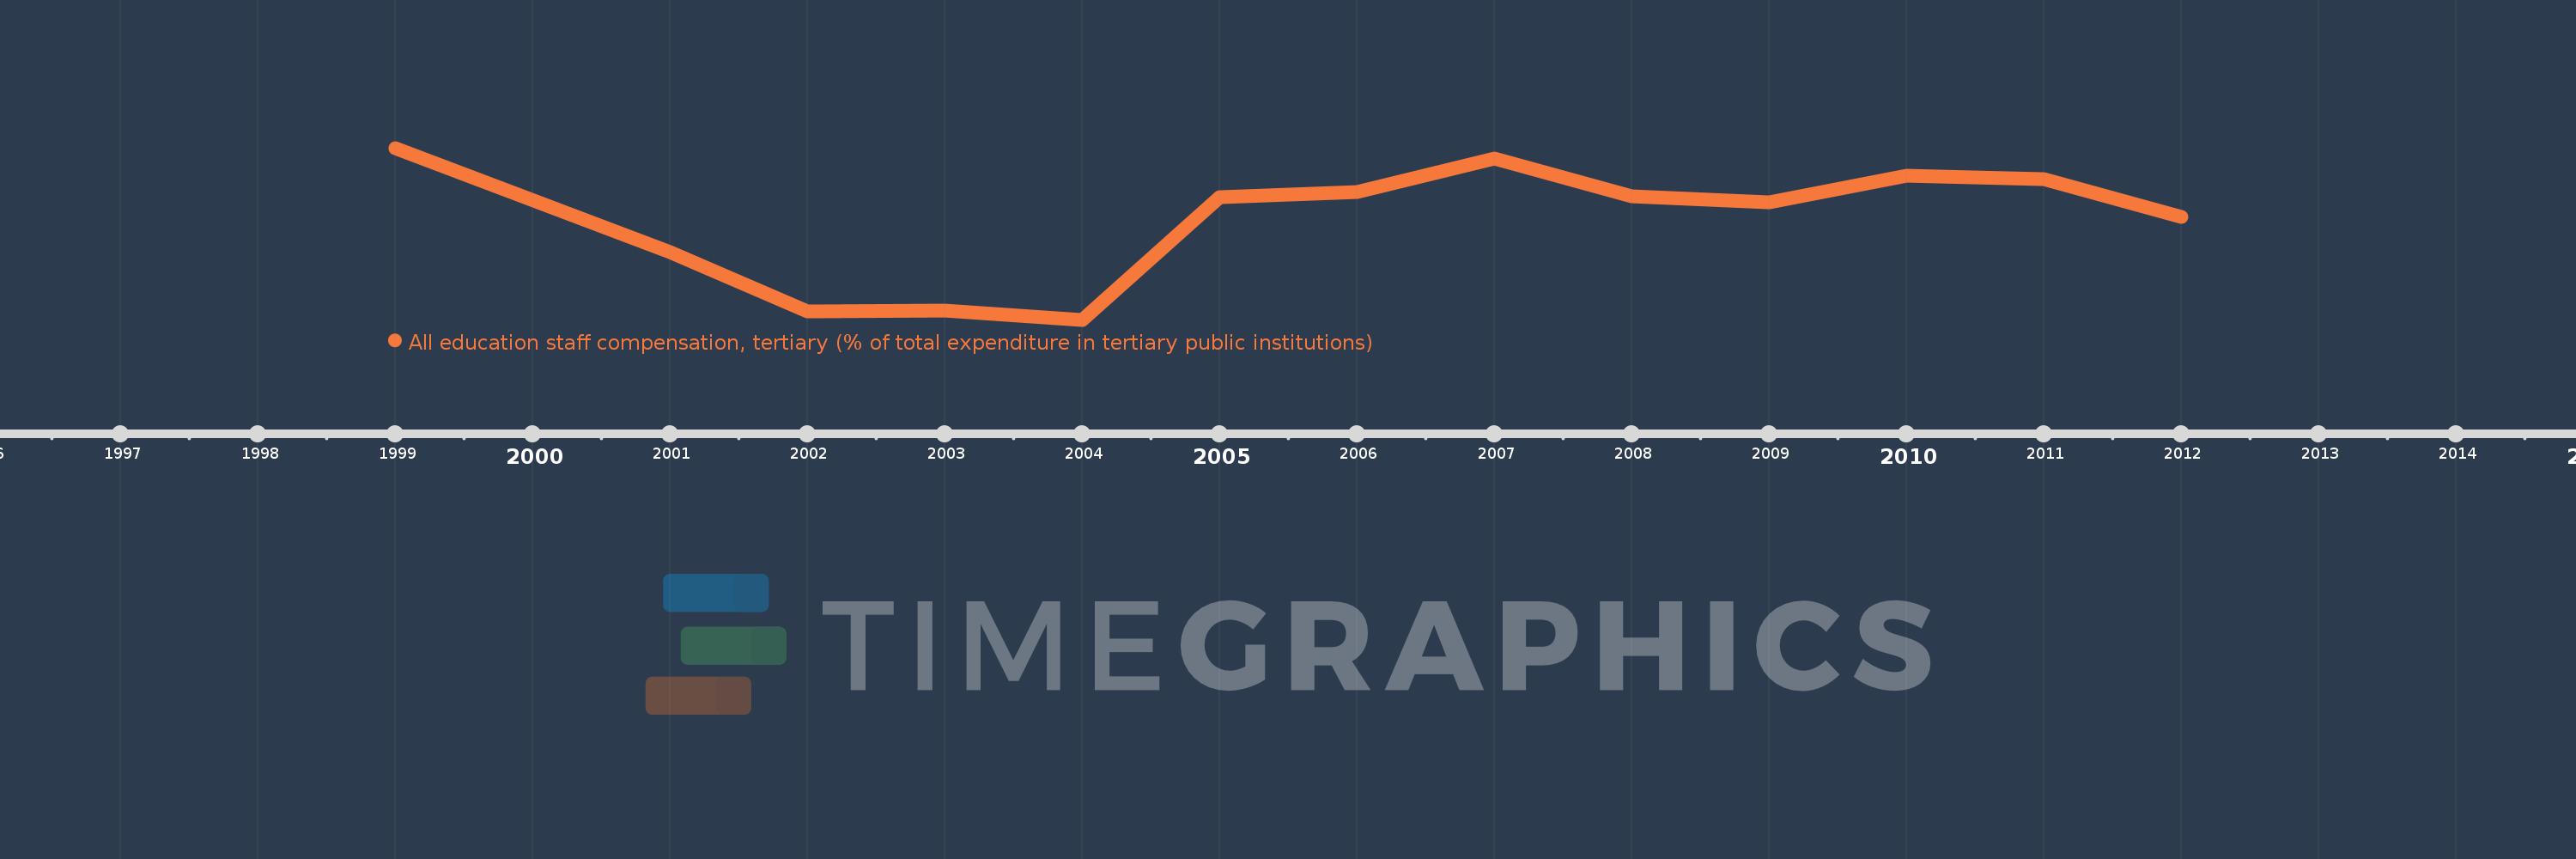
All education staff compensation, tertiary (% of total expenditure in tertiary public institutions)
2012,2011,2010,2009,2008,2007,2006,2005,2004,2003,2002,2001,1999
This statistics in other country:
Timeline:
This timeline shows a graph from 1999 to 2012 of Italy. No data until 1998. Number of actual observations by date: 13.
Source name:
World Development Indicators
Source organization:
United Nations Educational, Scientific, and Cultural Organization (UNESCO) Institute for Statistics.
Categories, topics:
Education
Last updated:
apr 23, 2017
Indicators value changes by year
Minimum:
52.148
jan 1, 2004
Maximum:
62.173
jan 1, 1999
At the date of observation
Value
Absolute change
Change from previous value
jan 1, 1999
62.173
+62.173
0.0%
jan 1, 2001
56.08
-6.093
-9.8%
jan 1, 2002
52.659
-3.421
-6.1%
jan 1, 2003
52.662
+0.002
0.0%
jan 1, 2004
52.148
-0.513
-0.97%
jan 1, 2005
59.283
+7.135
13.68%
jan 1, 2006
59.586
+0.303
0.51%
jan 1, 2007
61.565
+1.979
3.32%
jan 1, 2008
59.363
-2.202
-3.58%
jan 1, 2009
59.017
-0.347
-0.58%
jan 1, 2010
60.573
+1.556
2.64%
jan 1, 2011
60.373
-0.2
-0.33%
jan 1, 2012
58.163
-2.209
-3.66%
Ranking of countries by current statistics by years


Comments: