29
/
en
AIzaSyAYiBZKx7MnpbEhh9jyipgxe19OcubqV5w
April 1, 2024
242328
Slovenia
SVN
true
2
1
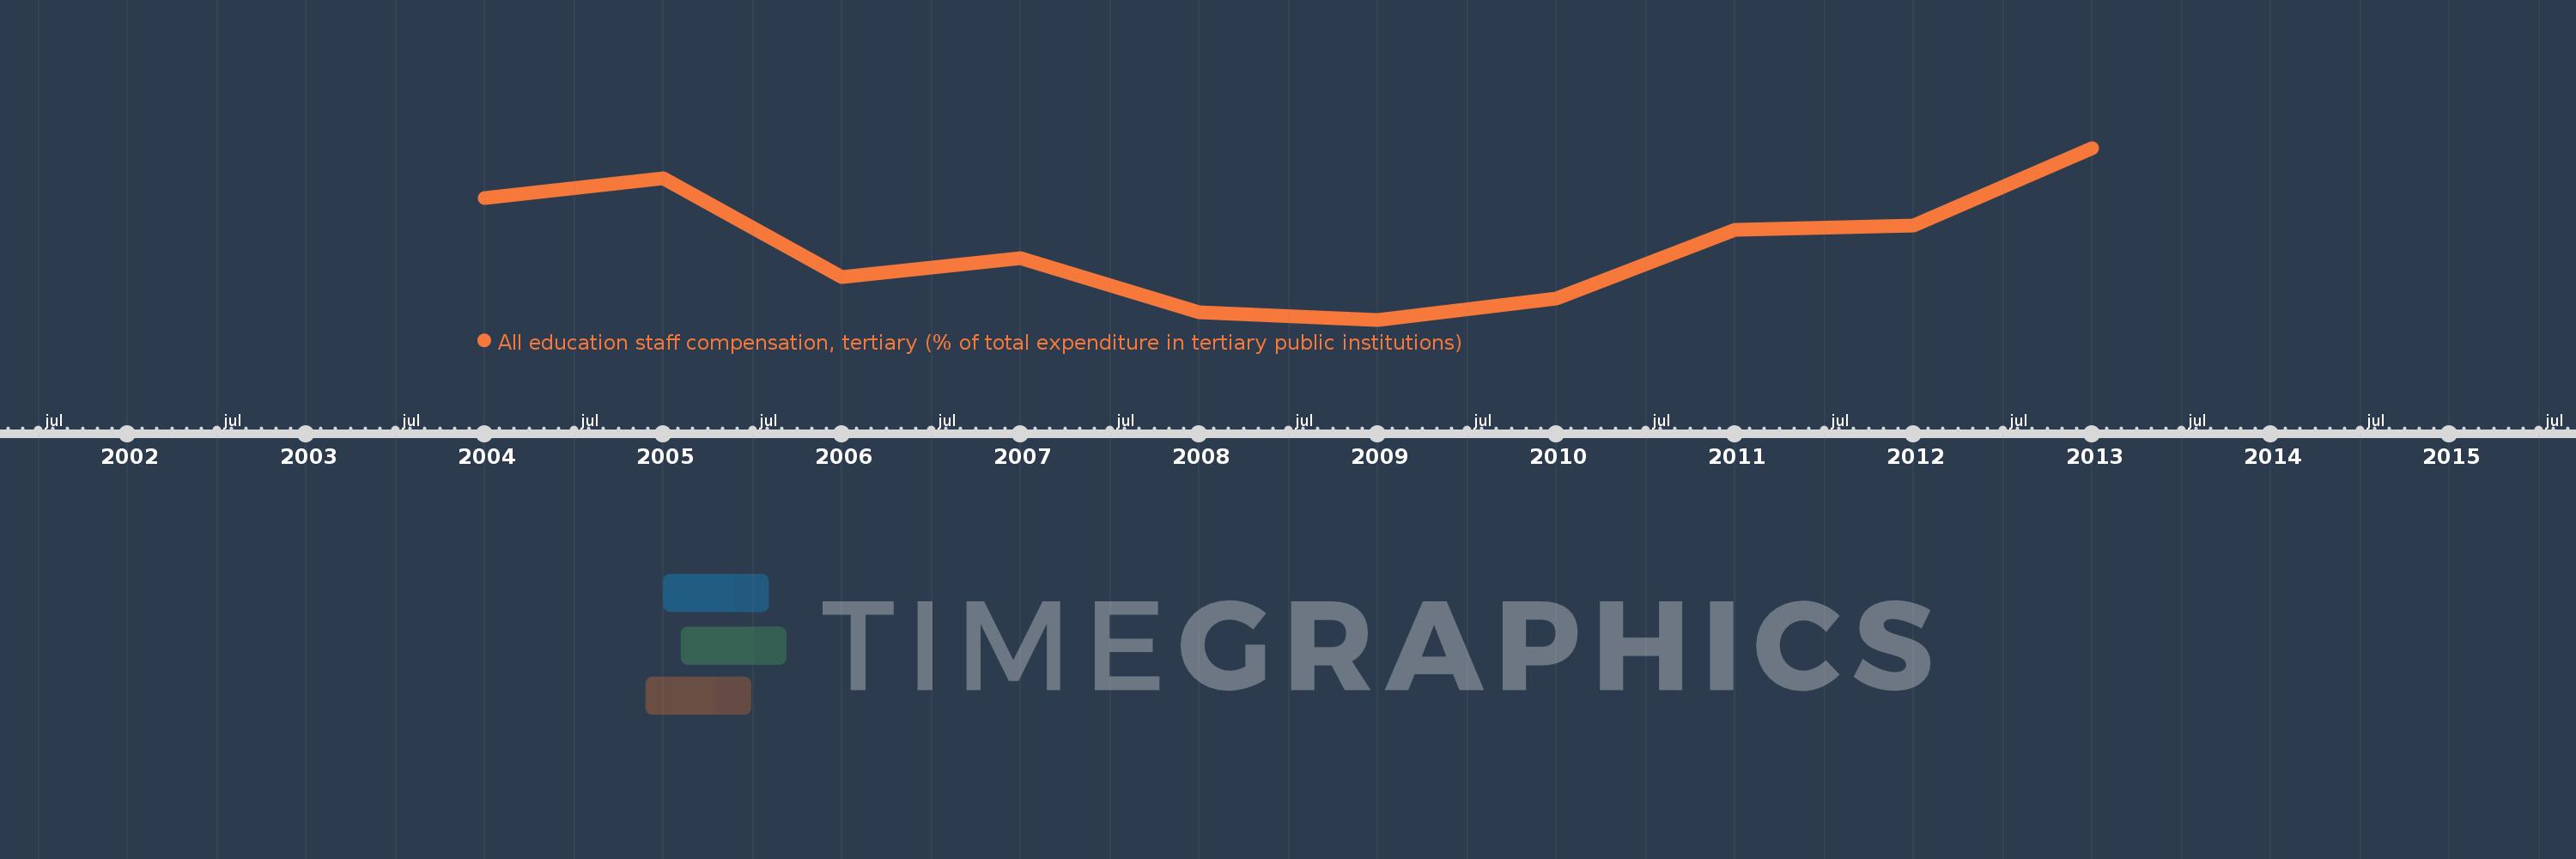
All education staff compensation, tertiary (% of total expenditure in tertiary public institutions)
2013,2012,2011,2010,2009,2008,2007,2006,2005,2004
This statistics in other country:
Timeline:
This timeline shows a graph from 2004 to 2013 of Slovenia. No data until 2003. Number of actual observations by date: 10.
Source name:
World Development Indicators
Source organization:
United Nations Educational, Scientific, and Cultural Organization (UNESCO) Institute for Statistics.
Categories, topics:
Education
Last updated:
apr 23, 2017
Indicators value changes by year
Minimum:
60.198
jan 1, 2009
Maximum:
64.841
jan 1, 2013
At the date of observation
Value
Absolute change
Change from previous value
jan 1, 2004
63.486
+63.486
0.0%
jan 1, 2005
64.031
+0.545
0.86%
jan 1, 2006
61.36
-2.671
-4.17%
jan 1, 2007
61.854
+0.494
0.8%
jan 1, 2008
60.389
-1.465
-2.37%
jan 1, 2009
60.198
-0.191
-0.32%
jan 1, 2010
60.78
+0.582
0.97%
jan 1, 2011
62.627
+1.847
3.04%
jan 1, 2012
62.745
+0.118
0.19%
jan 1, 2013
64.841
+2.096
3.34%
Ranking of countries by current statistics by years


Comments: