29
/
en
AIzaSyAYiBZKx7MnpbEhh9jyipgxe19OcubqV5w
April 1, 2024
257046
Switzerland
CHE
true
2
1
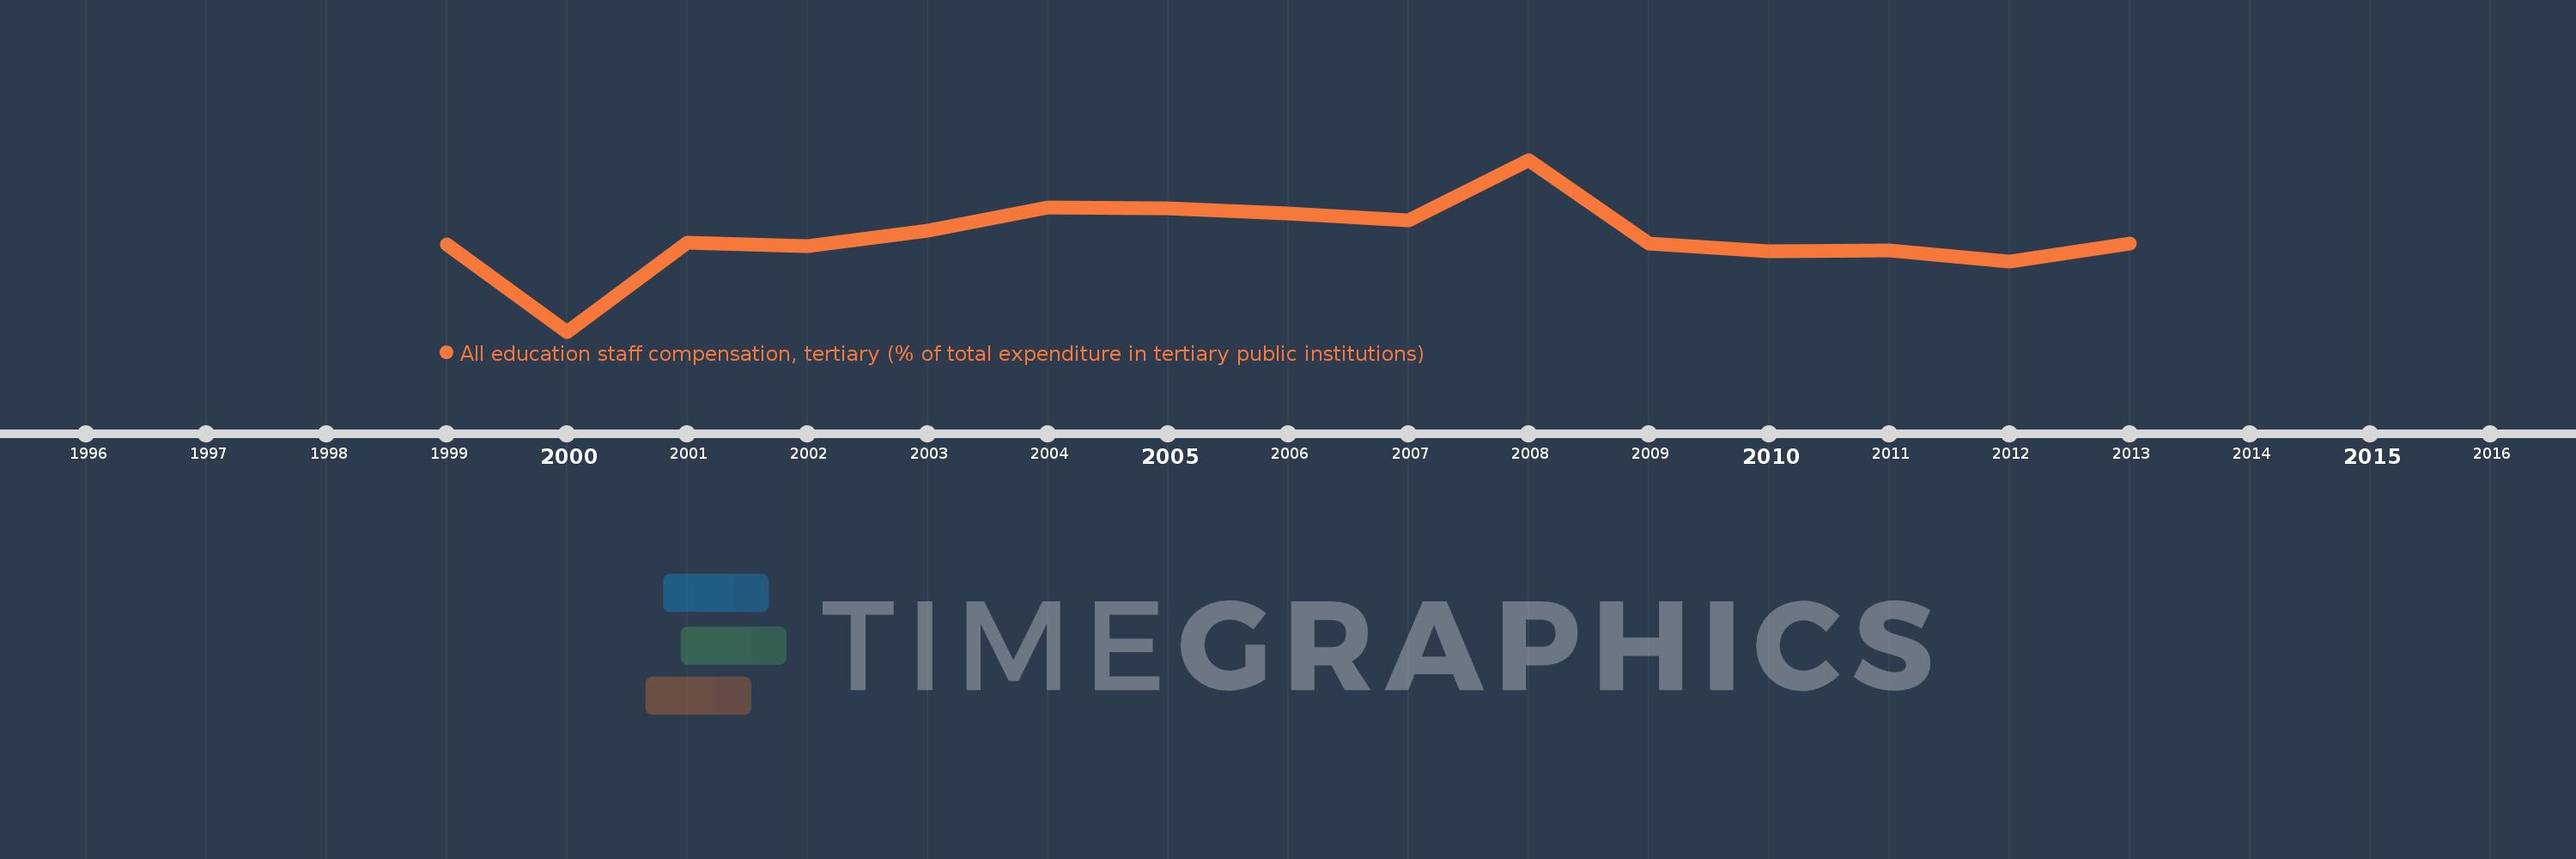
All education staff compensation, tertiary (% of total expenditure in tertiary public institutions)
2013,2012,2011,2010,2009,2008,2007,2006,2005,2004,2003,2002,2001,2000,1999
This statistics in other country:
Timeline:
This timeline shows a graph from 1999 to 2013 of Switzerland. No data until 1998. Number of actual observations by date: 15.
Source name:
World Development Indicators
Source organization:
United Nations Educational, Scientific, and Cultural Organization (UNESCO) Institute for Statistics.
Categories, topics:
Education
Last updated:
apr 23, 2017
Indicators value changes by year
Minimum:
63.112
jan 1, 2000
Maximum:
73.014
jan 1, 2008
At the date of observation
Value
Absolute change
Change from previous value
jan 1, 1999
68.139
+68.139
0.0%
jan 1, 2000
63.112
-5.027
-7.38%
jan 1, 2001
68.259
+5.147
8.16%
jan 1, 2002
68.026
-0.234
-0.34%
jan 1, 2003
68.93
+0.904
1.33%
jan 1, 2004
70.274
+1.344
1.95%
jan 1, 2005
70.24
-0.034
-0.05%
jan 1, 2006
69.926
-0.314
-0.45%
jan 1, 2007
69.501
-0.425
-0.61%
jan 1, 2008
73.014
+3.513
5.05%
jan 1, 2009
68.163
-4.851
-6.64%
jan 1, 2010
67.725
-0.438
-0.64%
jan 1, 2011
67.807
+0.082
0.12%
jan 1, 2012
67.164
-0.643
-0.95%
jan 1, 2013
68.175
+1.012
1.51%
Ranking of countries by current statistics by years


Comments: