29
/
en
AIzaSyAYiBZKx7MnpbEhh9jyipgxe19OcubqV5w
April 1, 2024
72708
Australia
AUS
true
2
1
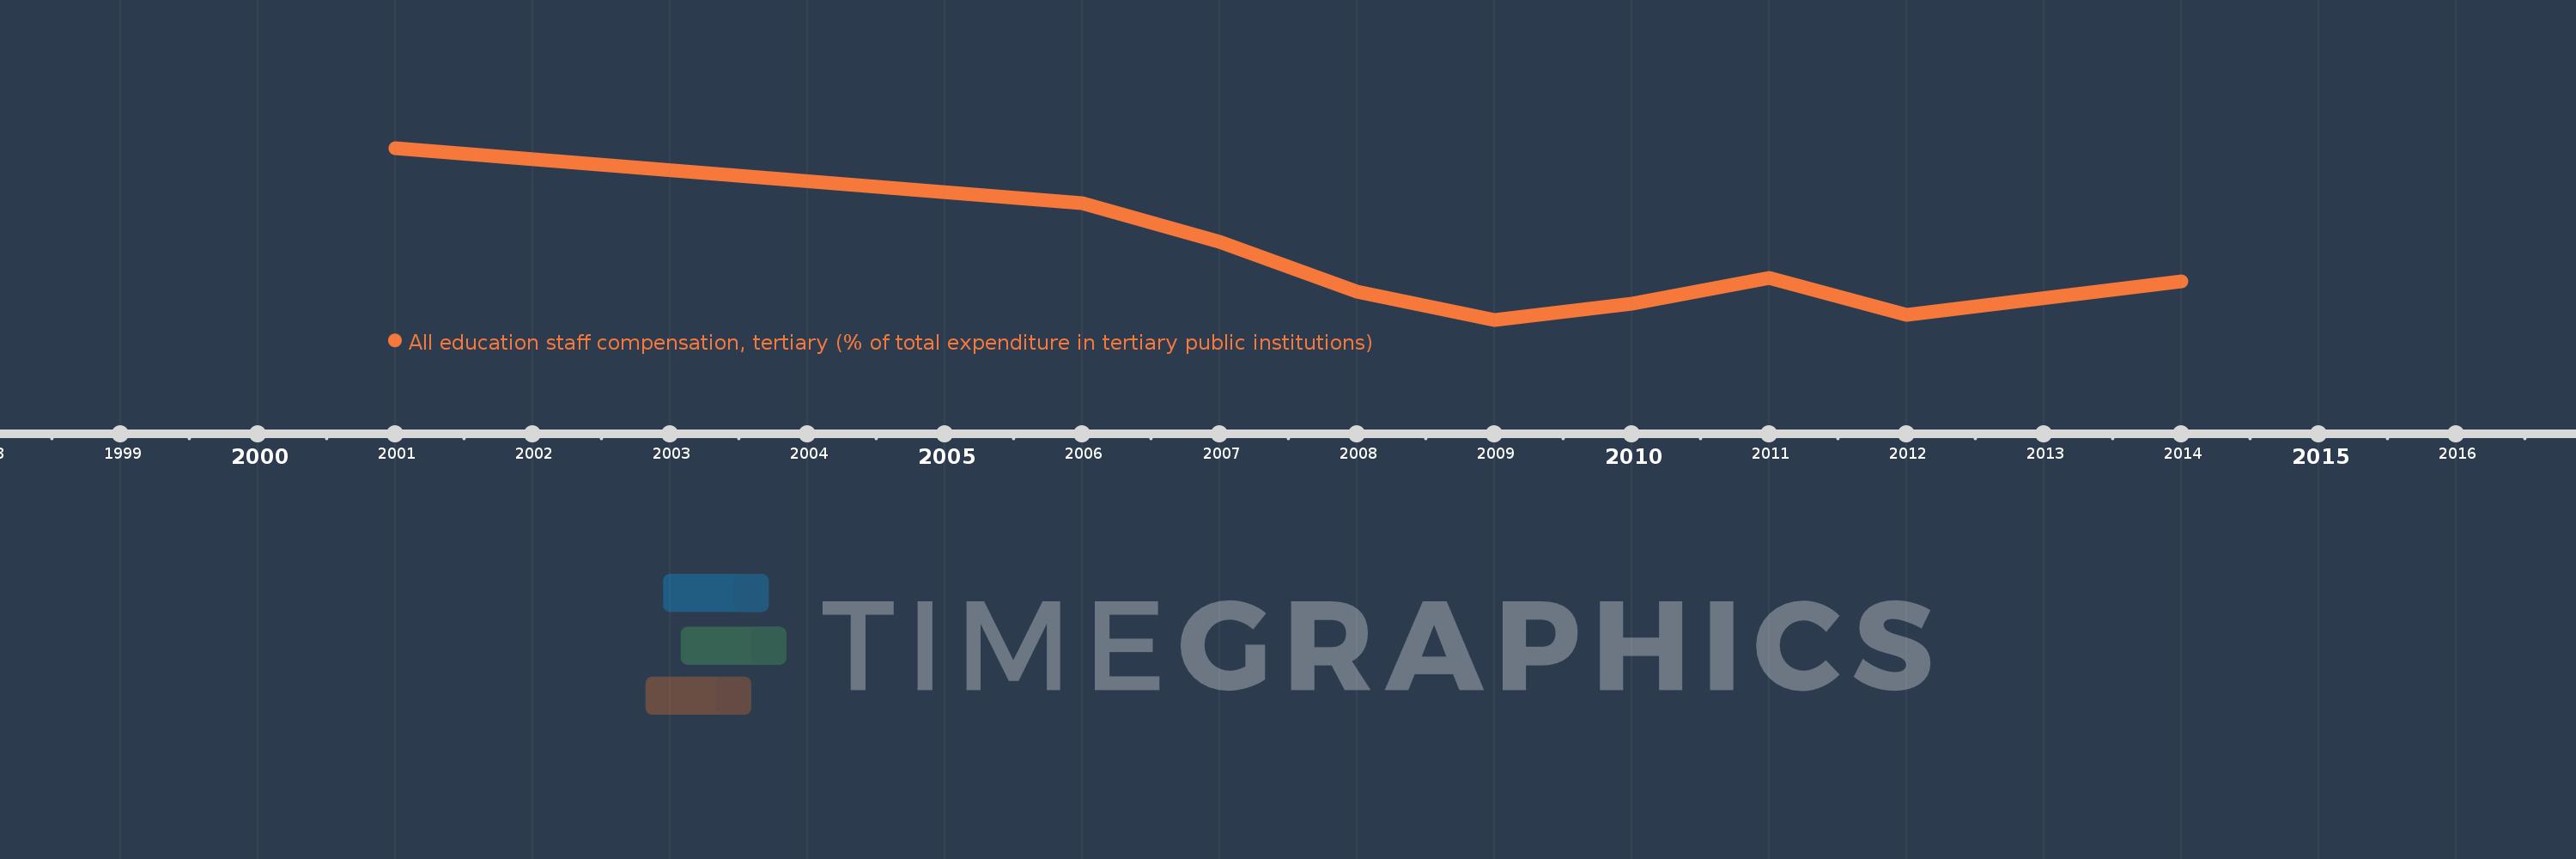
All education staff compensation, tertiary (% of total expenditure in tertiary public institutions)
2014,2012,2011,2010,2009,2008,2007,2006,2001
This statistics in other country:
Timeline:
This timeline shows a graph from 2001 to 2014 of Australia. No data until 2000. Number of actual observations by date: 9.
Source name:
World Development Indicators
Source organization:
United Nations Educational, Scientific, and Cultural Organization (UNESCO) Institute for Statistics.
Categories, topics:
Education
Last updated:
apr 23, 2017
Indicators value changes by year
Minimum:
53.125
jan 1, 2009
Maximum:
57.895
jan 1, 2001
At the date of observation
Value
Absolute change
Change from previous value
jan 1, 2001
57.895
+57.895
0.0%
jan 1, 2006
56.367
-1.529
-2.64%
jan 1, 2007
55.284
-1.083
-1.92%
jan 1, 2008
53.915
-1.369
-2.48%
jan 1, 2009
53.125
-0.79
-1.47%
jan 1, 2010
53.579
+0.454
0.86%
jan 1, 2011
54.293
+0.715
1.33%
jan 1, 2012
53.25
-1.044
-1.92%
jan 1, 2014
54.194
+0.944
1.77%
Ranking of countries by current statistics by years


Comments: