29
/
en
AIzaSyAYiBZKx7MnpbEhh9jyipgxe19OcubqV5w
April 1, 2024
195174
Mexico
MEX
true
2
1
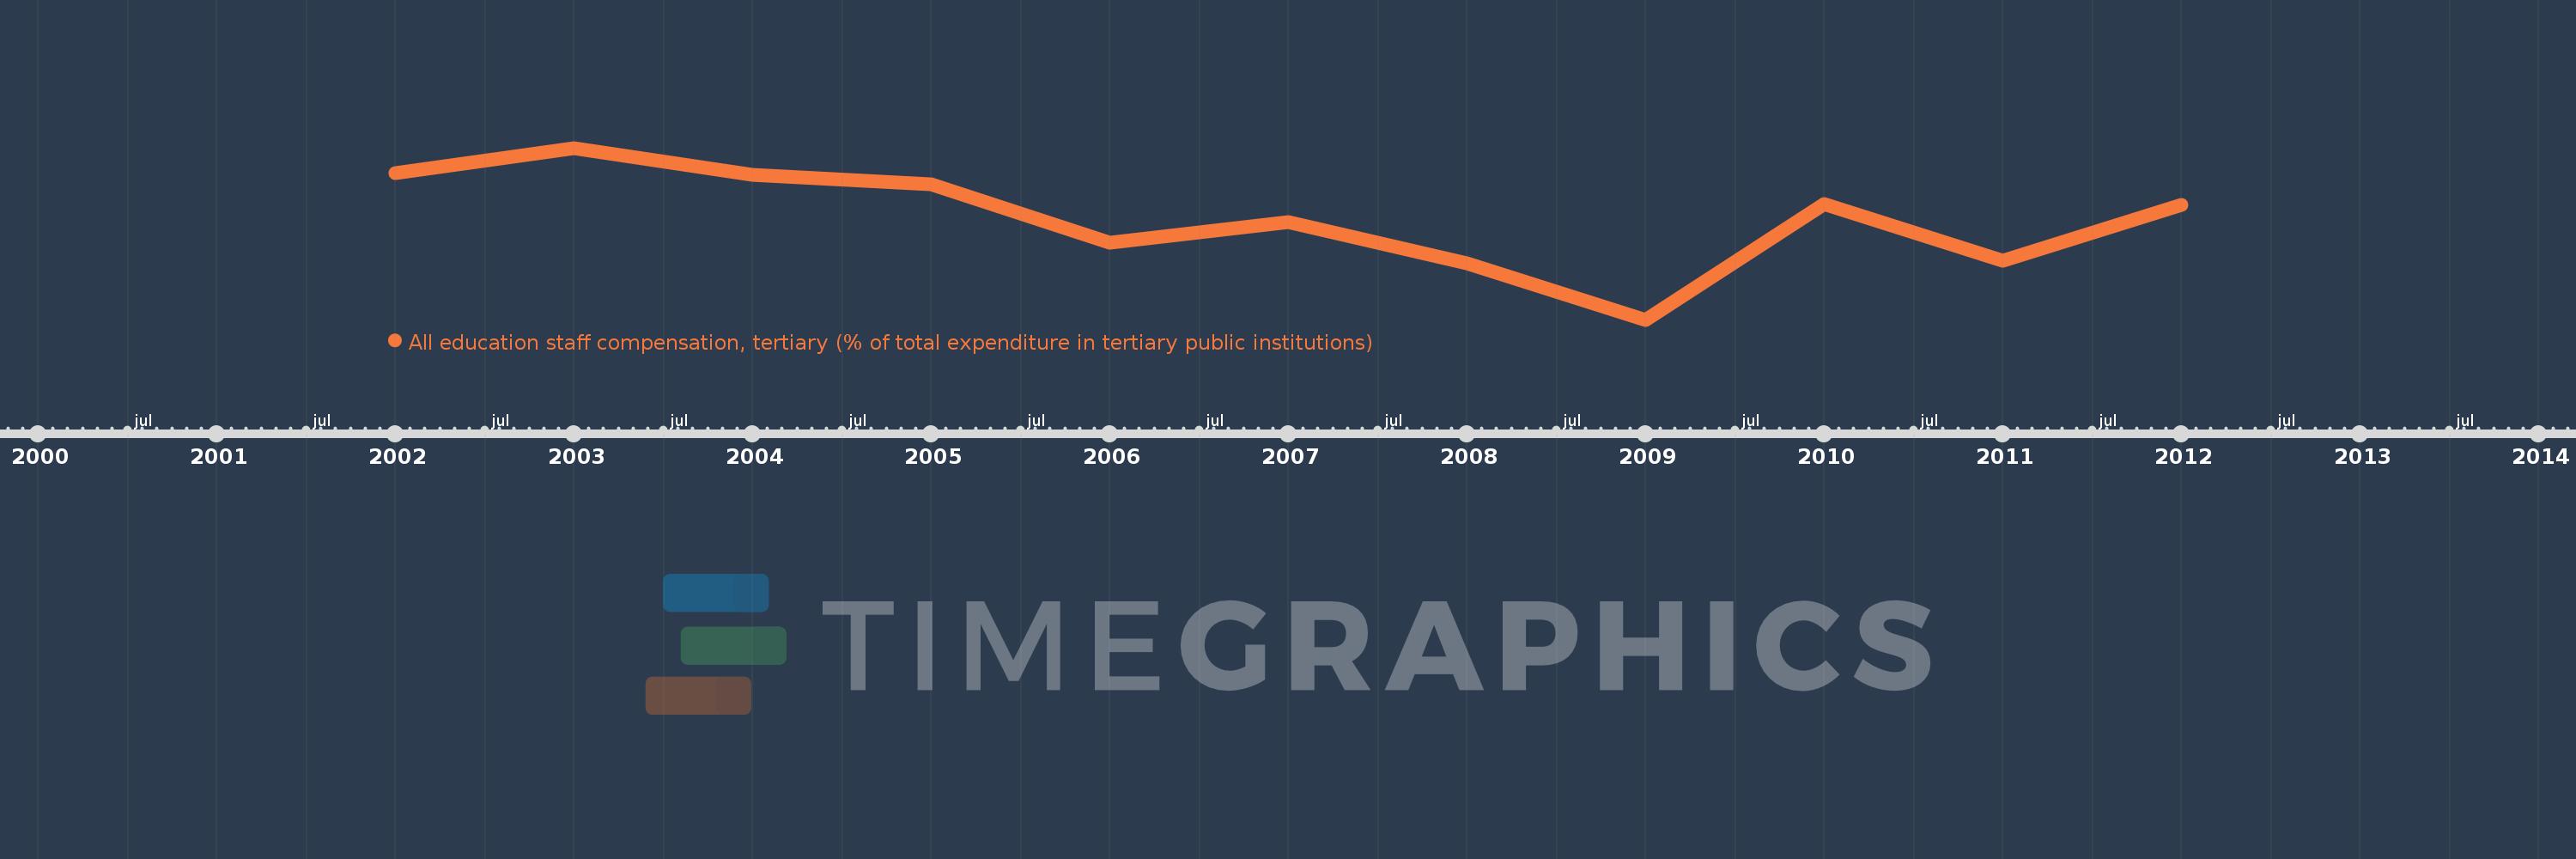
All education staff compensation, tertiary (% of total expenditure in tertiary public institutions)
2012,2011,2010,2009,2008,2007,2006,2005,2004,2003,2002
This statistics in other country:
Timeline:
This timeline shows a graph from 2002 to 2012 of Mexico. No data until 2001. Number of actual observations by date: 11.
Source name:
World Development Indicators
Source organization:
United Nations Educational, Scientific, and Cultural Organization (UNESCO) Institute for Statistics.
Categories, topics:
Education
Last updated:
apr 23, 2017
Indicators value changes by year
Minimum:
63.049
jan 1, 2009
Maximum:
75.209
jan 1, 2003
At the date of observation
Value
Absolute change
Change from previous value
jan 1, 2002
73.452
+73.452
0.0%
jan 1, 2003
75.209
+1.756
2.39%
jan 1, 2004
73.276
-1.933
-2.57%
jan 1, 2005
72.646
-0.629
-0.86%
jan 1, 2006
68.473
-4.173
-5.74%
jan 1, 2007
69.983
+1.51
2.21%
jan 1, 2008
67.051
-2.932
-4.19%
jan 1, 2009
63.049
-4.002
-5.97%
jan 1, 2010
71.233
+8.185
12.98%
jan 1, 2011
67.198
-4.036
-5.67%
jan 1, 2012
71.186
+3.989
5.94%
Ranking of countries by current statistics by years


Comments: