29
/
en
AIzaSyAYiBZKx7MnpbEhh9jyipgxe19OcubqV5w
April 1, 2024
100845
Canada
CAN
true
2
1
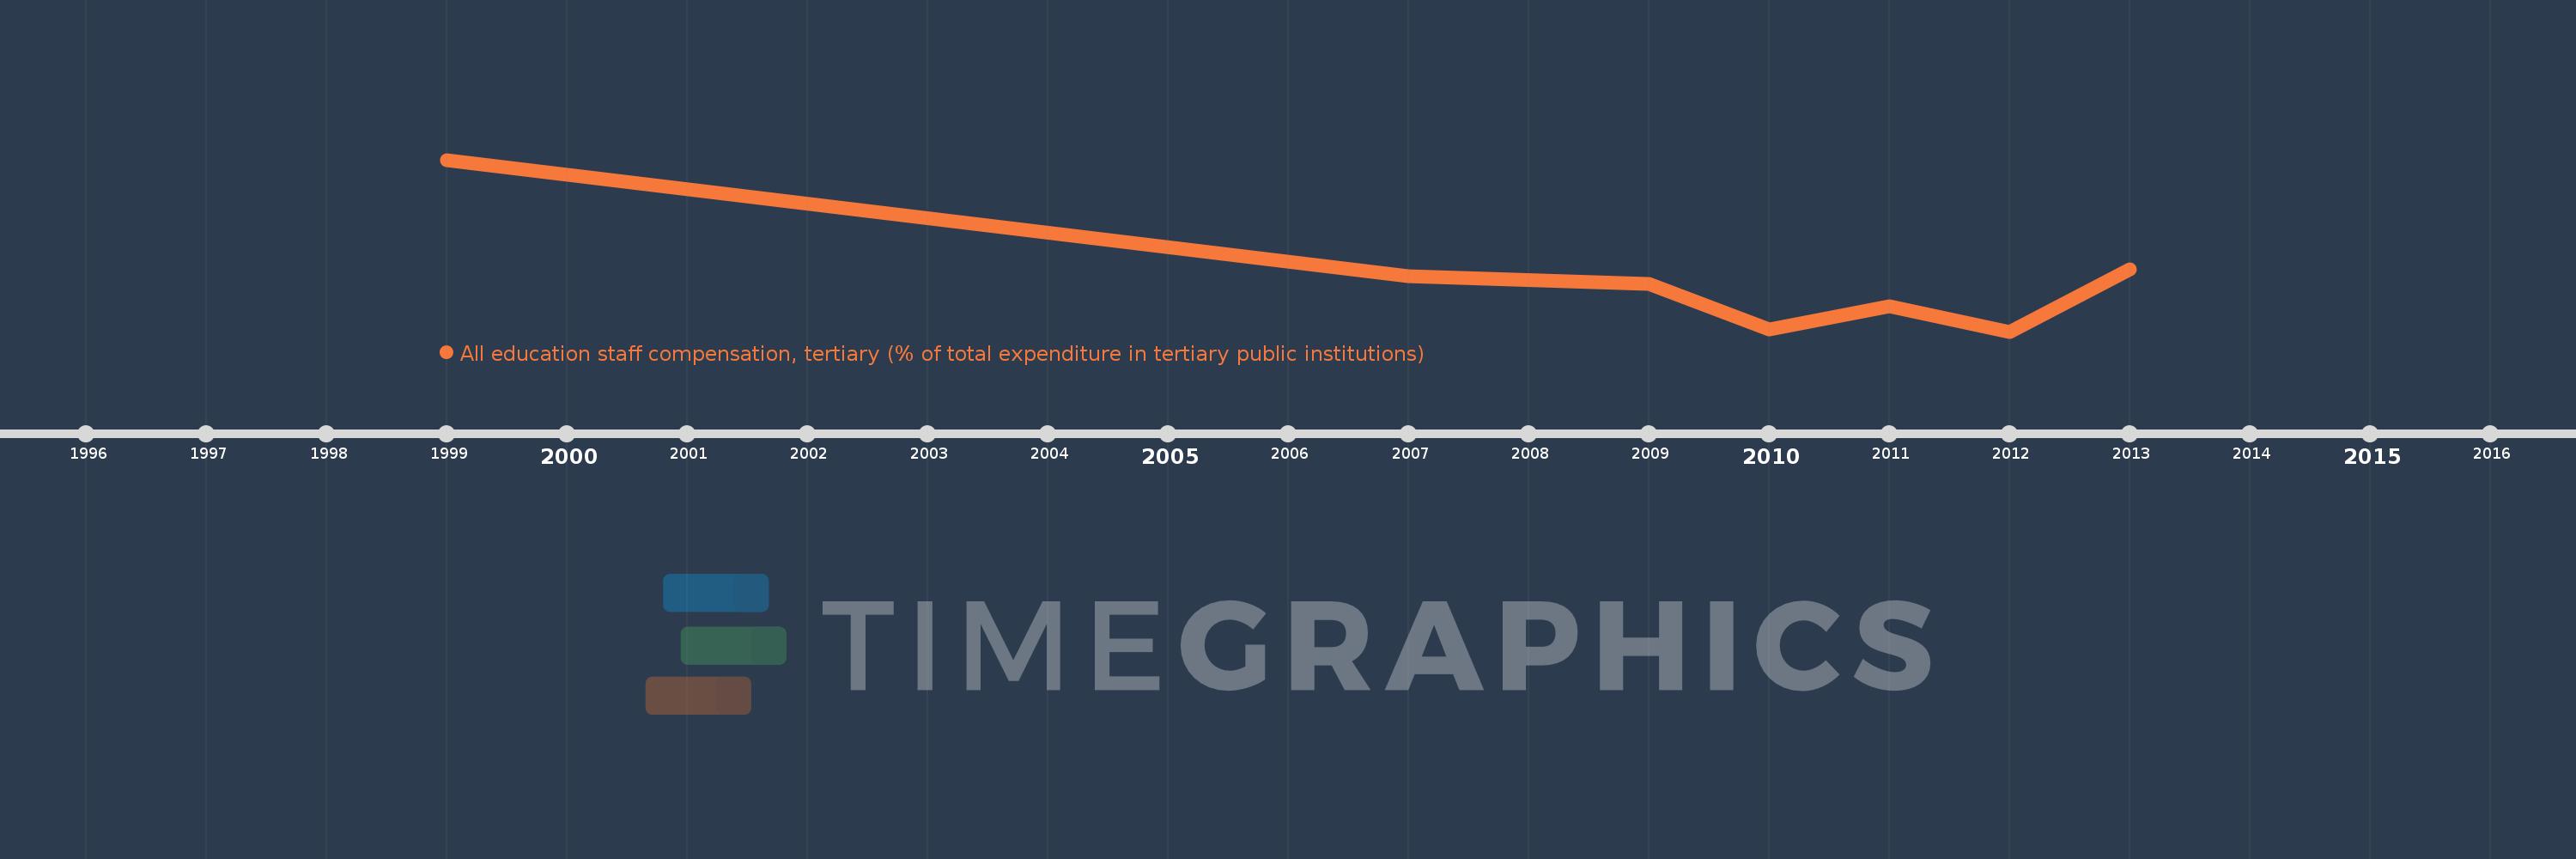
All education staff compensation, tertiary (% of total expenditure in tertiary public institutions)
2013,2012,2011,2010,2009,2007,1999
This statistics in other country:
Timeline:
This timeline shows a graph from 1999 to 2013 of Canada. No data until 1998. Number of actual observations by date: 7.
Source name:
World Development Indicators
Source organization:
United Nations Educational, Scientific, and Cultural Organization (UNESCO) Institute for Statistics.
Categories, topics:
Education
Last updated:
apr 23, 2017
Indicators value changes by year
Minimum:
55.768
jan 1, 2012
Maximum:
65.375
jan 1, 1999
At the date of observation
Value
Absolute change
Change from previous value
jan 1, 1999
65.375
+65.375
0.0%
jan 1, 2007
58.845
-6.53
-9.99%
jan 1, 2009
58.442
-0.403
-0.69%
jan 1, 2010
55.865
-2.577
-4.41%
jan 1, 2011
57.202
+1.337
2.39%
jan 1, 2012
55.768
-1.435
-2.51%
jan 1, 2013
59.242
+3.475
6.23%
Ranking of countries by current statistics by years


Comments: