29
/
en
AIzaSyAYiBZKx7MnpbEhh9jyipgxe19OcubqV5w
April 1, 2024
220450
Paraguay
PRY
true
2
1
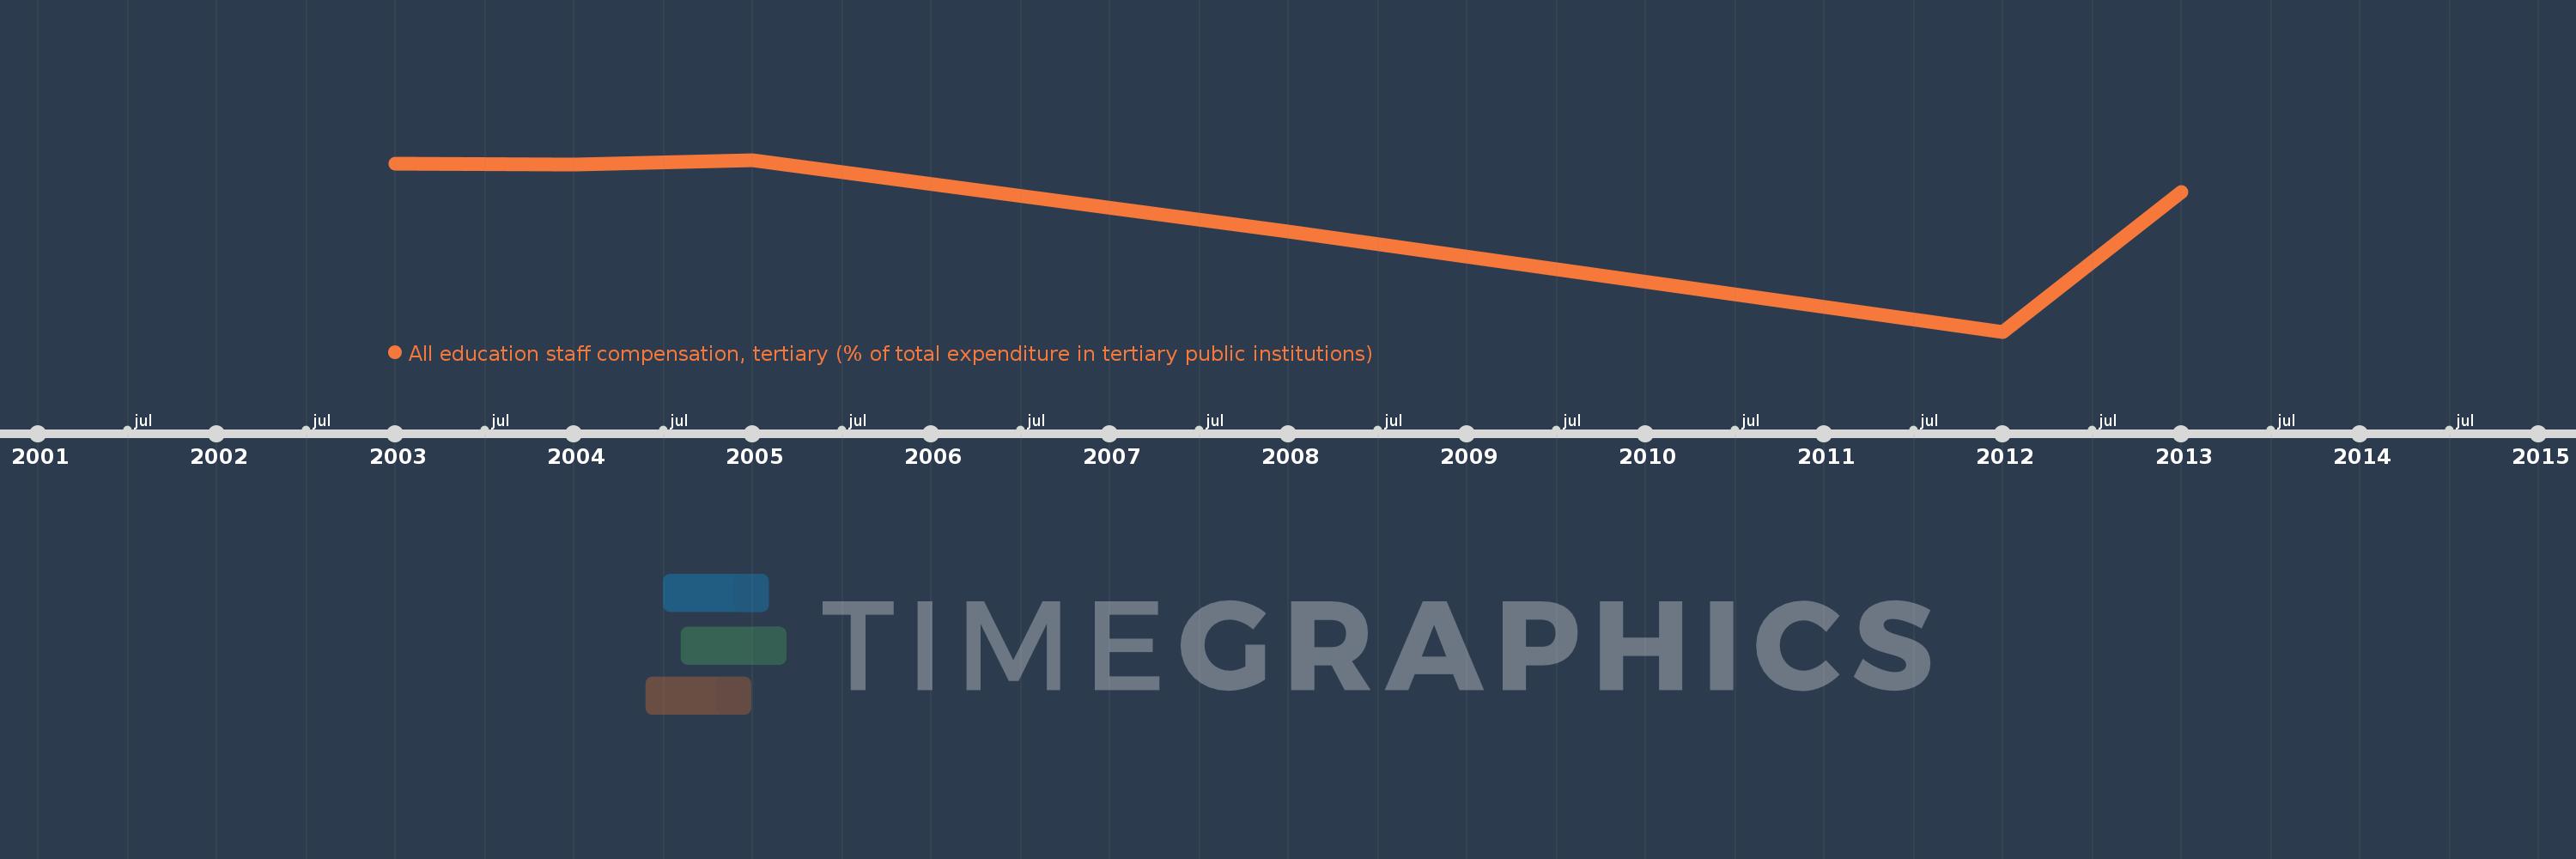
All education staff compensation, tertiary (% of total expenditure in tertiary public institutions)
2013,2012,2008,2005,2004,2003
This statistics in other country:
Timeline:
This timeline shows a graph from 2003 to 2013 of Paraguay. No data until 2002. Number of actual observations by date: 6.
Source name:
World Development Indicators
Source organization:
United Nations Educational, Scientific, and Cultural Organization (UNESCO) Institute for Statistics.
Categories, topics:
Education
Last updated:
apr 23, 2017
Indicators value changes by year
Minimum:
43.144
jan 1, 2012
Maximum:
92.374
jan 1, 2005
At the date of observation
Value
Absolute change
Change from previous value
jan 1, 2003
91.153
+91.153
0.0%
jan 1, 2004
91.118
-0.034
-0.04%
jan 1, 2005
92.374
+1.255
1.38%
jan 1, 2008
71.91
-20.464
-22.15%
jan 1, 2012
43.144
-28.766
-40.0%
jan 1, 2013
83.121
+39.977
92.66%
Ranking of countries by current statistics by years


Comments: