29
/
en
AIzaSyAYiBZKx7MnpbEhh9jyipgxe19OcubqV5w
April 1, 2024
81490
Belgium
BEL
true
2
1
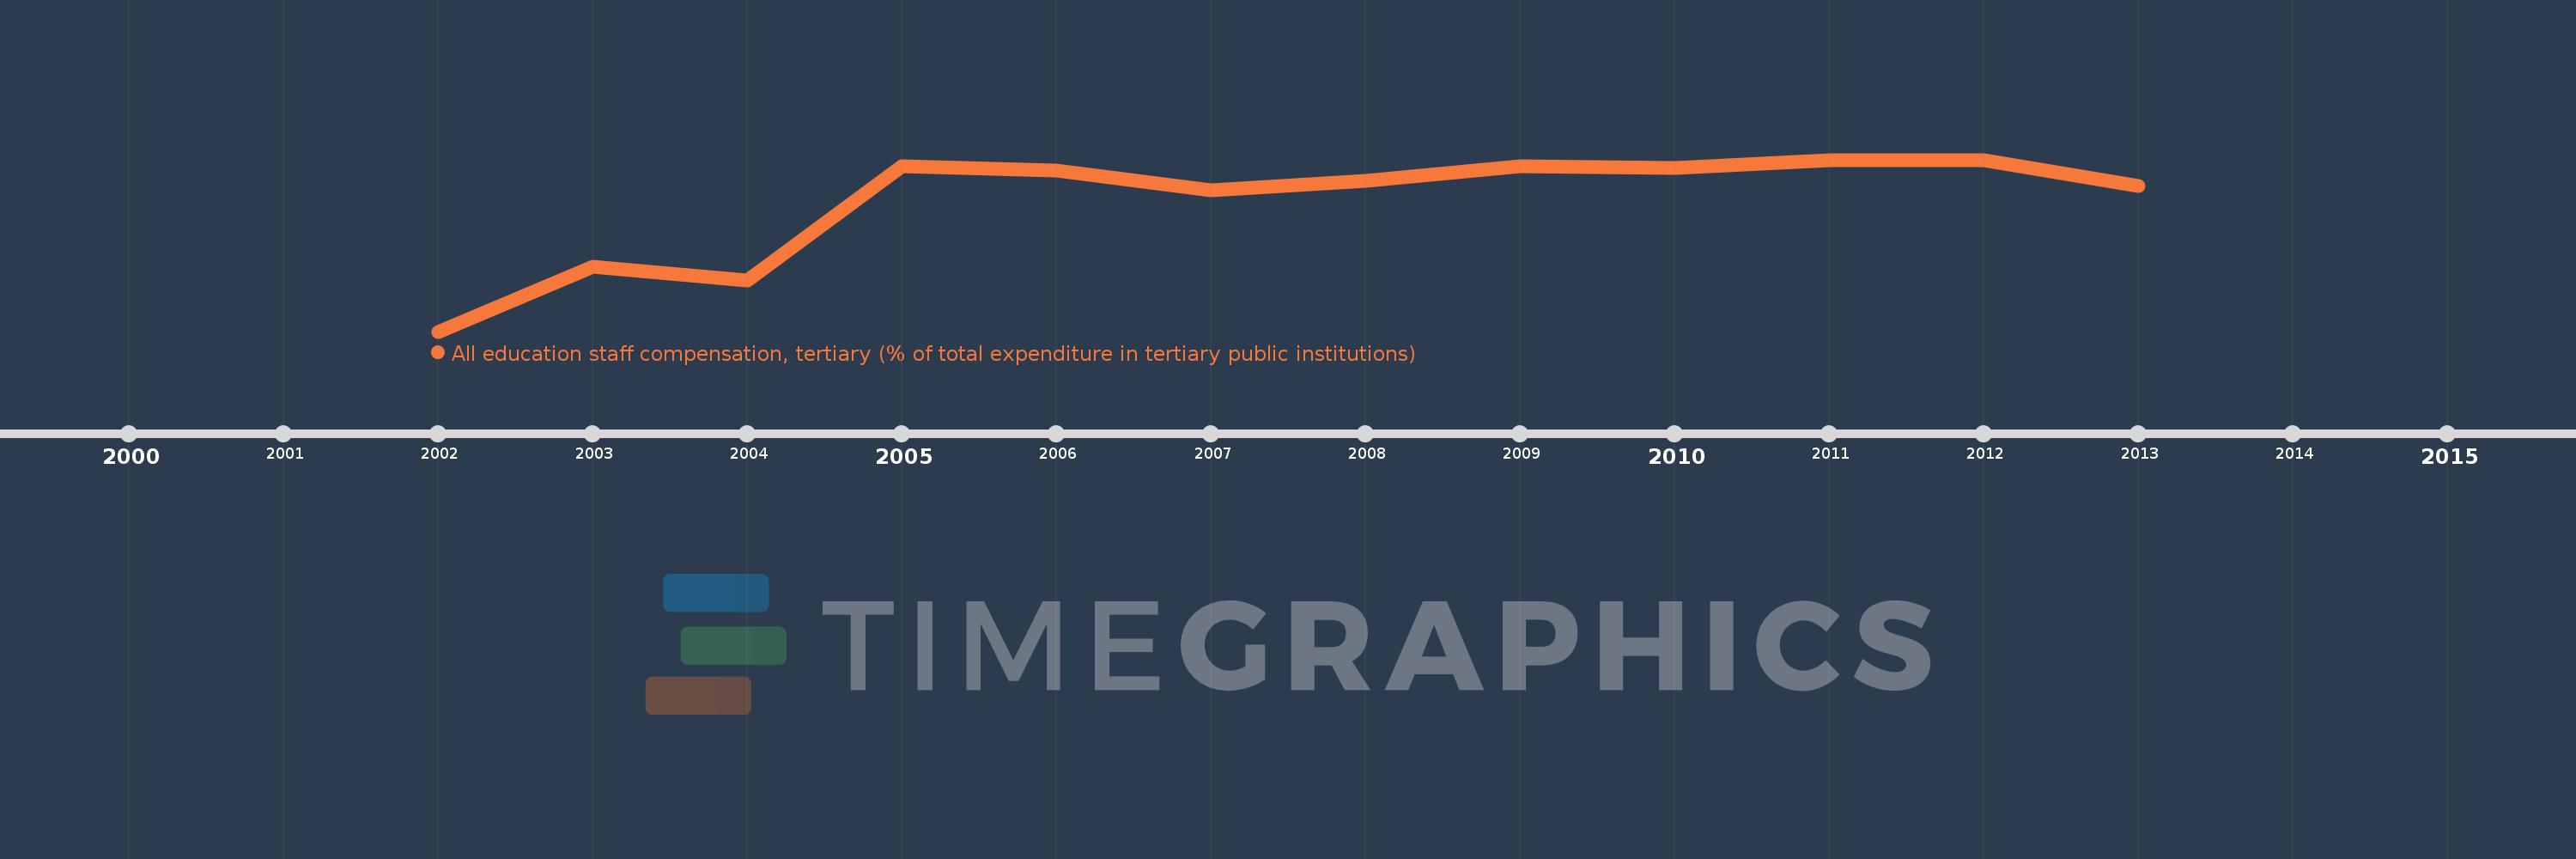
All education staff compensation, tertiary (% of total expenditure in tertiary public institutions)
2013,2012,2011,2010,2009,2008,2007,2006,2005,2004,2003,2002
This statistics in other country:
Timeline:
This timeline shows a graph from 2002 to 2013 of Belgium. No data until 2001. Number of actual observations by date: 12.
Source name:
World Development Indicators
Source organization:
United Nations Educational, Scientific, and Cultural Organization (UNESCO) Institute for Statistics.
Categories, topics:
Education
Last updated:
apr 23, 2017
Indicators value changes by year
Minimum:
66.016
jan 1, 2002
At the date of observation
Value
Absolute change
Change from previous value
jan 1, 2002
66.016
+66.016
0.0%
jan 1, 2003
70.343
+4.328
6.56%
jan 1, 2004
69.425
-0.918
-1.31%
jan 1, 2005
77.025
+7.6
10.95%
jan 1, 2006
76.706
-0.319
-0.41%
jan 1, 2007
75.395
-1.311
-1.71%
jan 1, 2008
76.049
+0.655
0.87%
jan 1, 2009
77.025
+0.976
1.28%
jan 1, 2010
76.863
-0.162
-0.21%
jan 1, 2011
77.378
+0.515
0.67%
jan 1, 2012
77.43
+0.052
0.07%
jan 1, 2013
75.705
-1.725
-2.23%
Ranking of countries by current statistics by years


Comments: