29
/
en
AIzaSyAYiBZKx7MnpbEhh9jyipgxe19OcubqV5w
April 1, 2024
116633
Cyprus
CYP
true
2
1
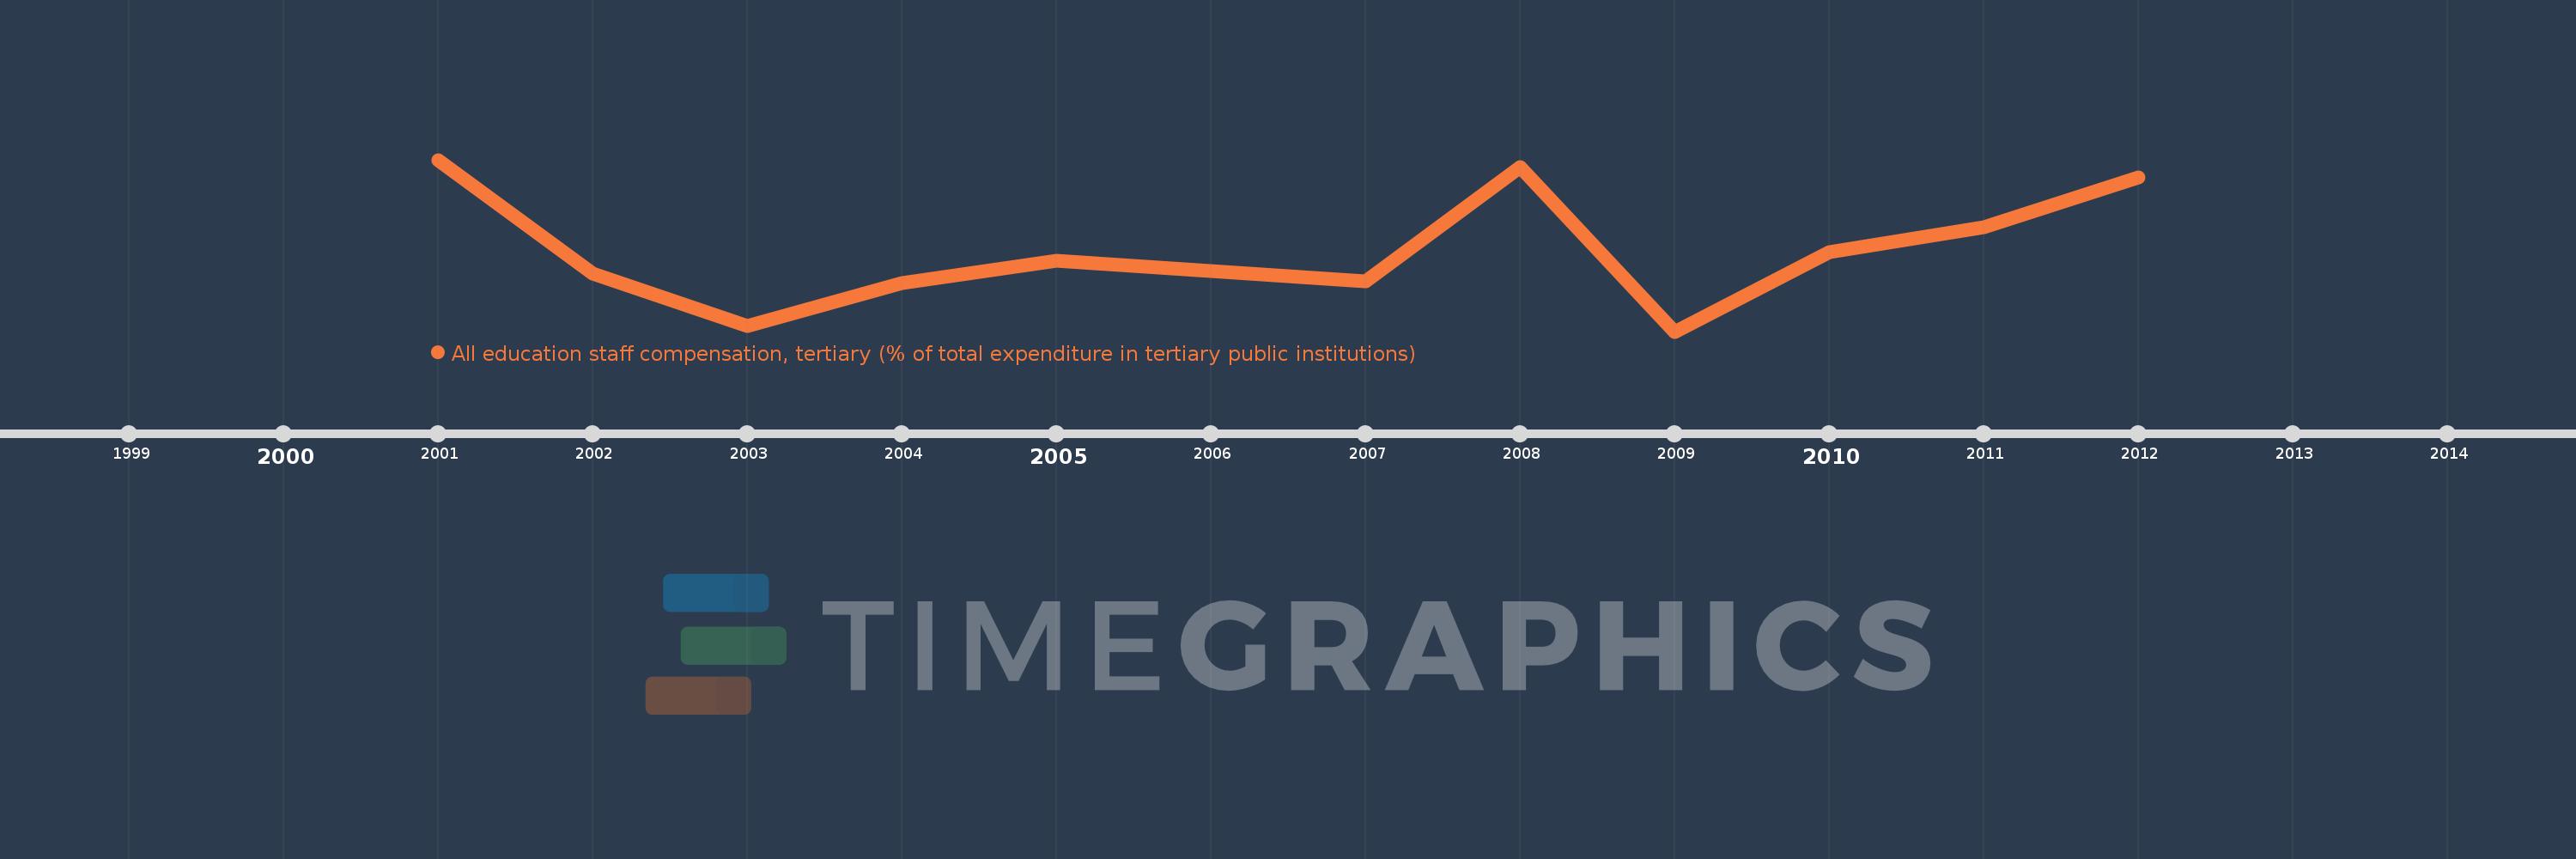
All education staff compensation, tertiary (% of total expenditure in tertiary public institutions)
2012,2011,2010,2009,2008,2007,2006,2005,2004,2003,2002,2001
This statistics in other country:
Timeline:
This timeline shows a graph from 2001 to 2012 of Cyprus. No data until 2000. Number of actual observations by date: 12.
Source name:
World Development Indicators
Source organization:
United Nations Educational, Scientific, and Cultural Organization (UNESCO) Institute for Statistics.
Categories, topics:
Education
Last updated:
apr 23, 2017
Indicators value changes by year
Minimum:
48.314
jan 1, 2009
Maximum:
63.602
jan 1, 2001
At the date of observation
Value
Absolute change
Change from previous value
jan 1, 2001
63.602
+63.602
0.0%
jan 1, 2002
53.508
-10.093
-15.87%
jan 1, 2003
48.837
-4.671
-8.73%
jan 1, 2004
52.652
+3.815
7.81%
jan 1, 2005
54.626
+1.975
3.75%
jan 1, 2006
53.678
-0.948
-1.74%
jan 1, 2007
52.801
-0.877
-1.63%
jan 1, 2008
62.92
+10.119
19.16%
jan 1, 2009
48.314
-14.606
-23.21%
jan 1, 2010
55.402
+7.088
14.67%
jan 1, 2011
57.621
+2.219
4.01%
jan 1, 2012
62.014
+4.393
7.62%
Ranking of countries by current statistics by years


Comments: