29
/
en
AIzaSyAYiBZKx7MnpbEhh9jyipgxe19OcubqV5w
April 1, 2024
169640
Korea, Rep.
KOR
true
2
1
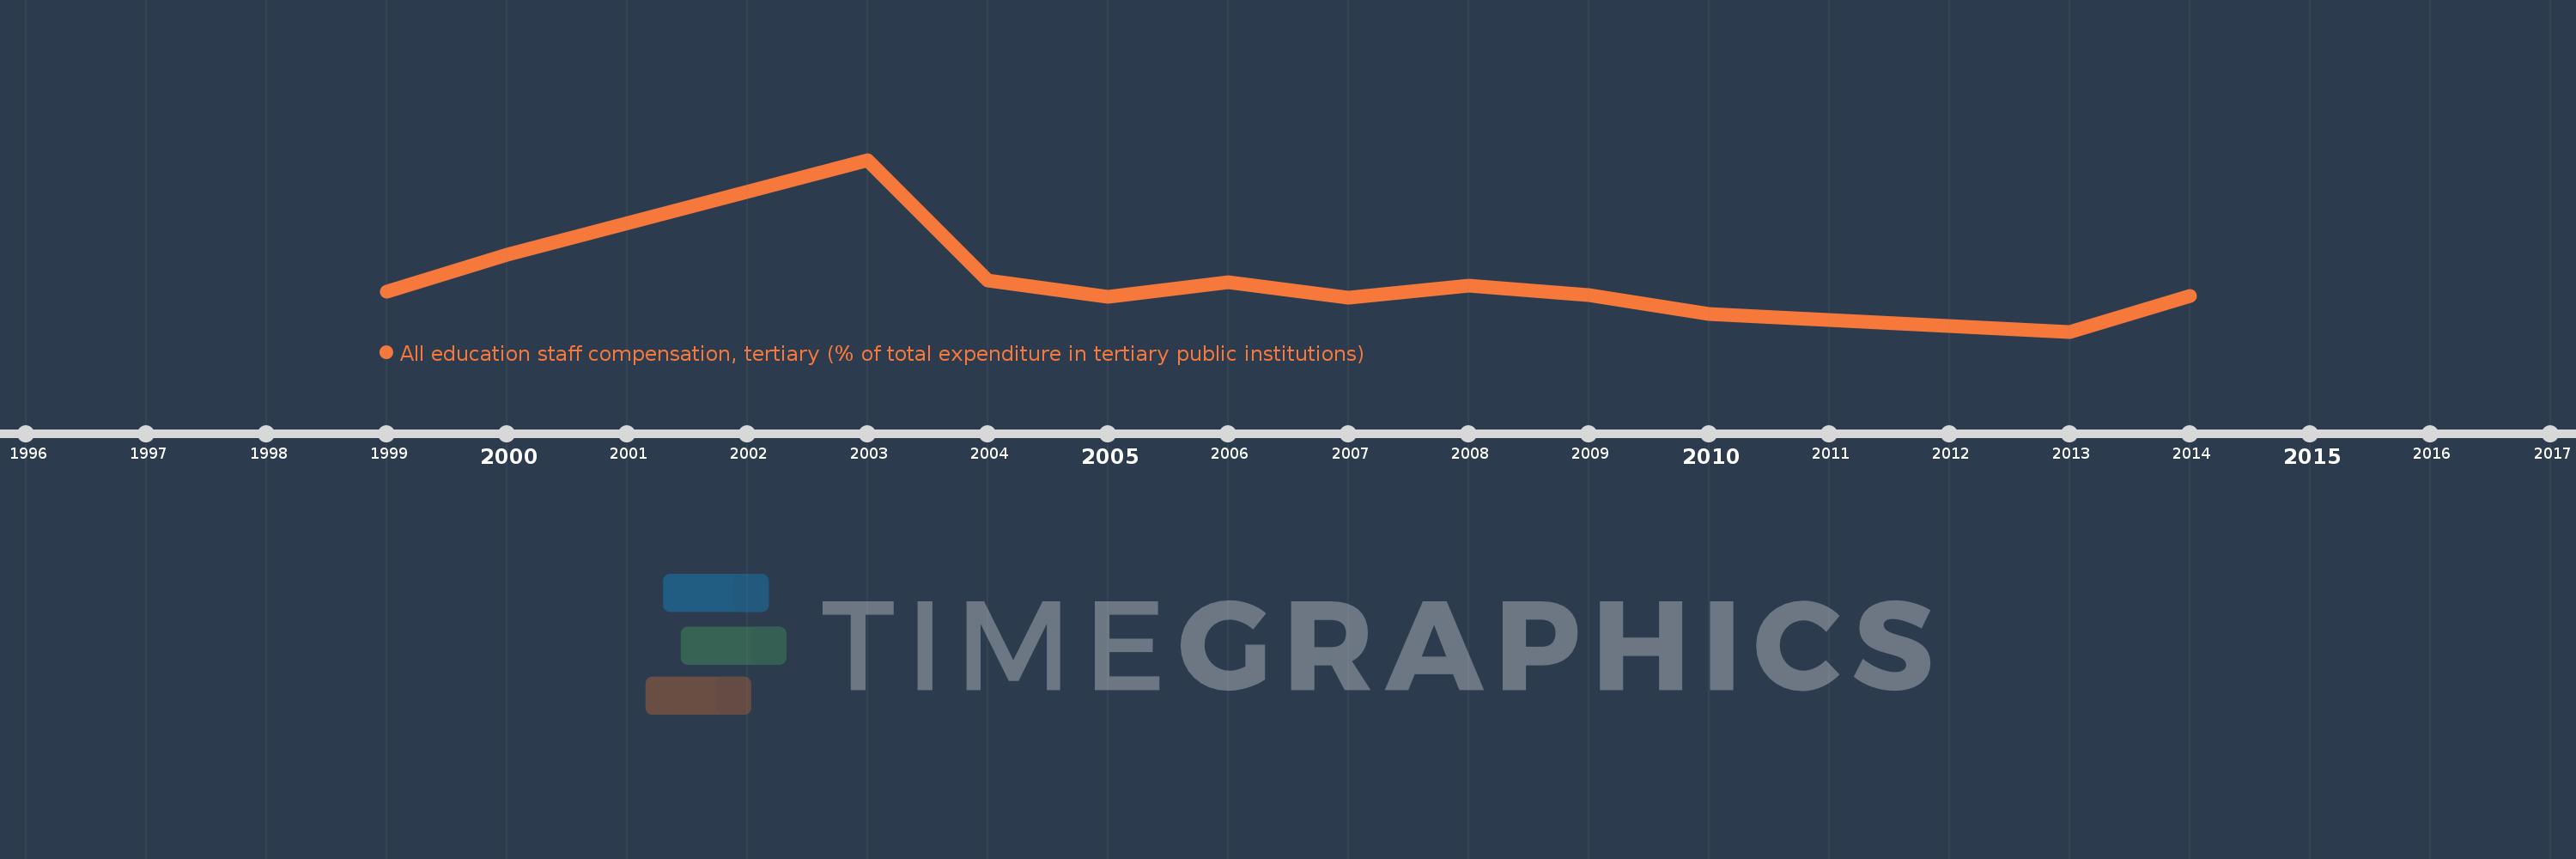
All education staff compensation, tertiary (% of total expenditure in tertiary public institutions)
2014,2013,2010,2009,2008,2007,2006,2005,2004,2003,2000,1999
This statistics in other country:
Timeline:
This timeline shows a graph from 1999 to 2014 of Korea, Rep.. No data until 1998. Number of actual observations by date: 12.
Source name:
World Development Indicators
Source organization:
United Nations Educational, Scientific, and Cultural Organization (UNESCO) Institute for Statistics.
Categories, topics:
Education
Last updated:
apr 23, 2017
Indicators value changes by year
Minimum:
41.967
jan 1, 2013
Maximum:
54.928
jan 1, 2003
At the date of observation
Value
Absolute change
Change from previous value
jan 1, 1999
44.965
+44.965
0.0%
jan 1, 2000
47.764
+2.798
6.22%
jan 1, 2003
54.928
+7.164
15.0%
jan 1, 2004
45.843
-9.085
-16.54%
jan 1, 2005
44.592
-1.251
-2.73%
jan 1, 2006
45.705
+1.114
2.5%
jan 1, 2007
44.499
-1.206
-2.64%
jan 1, 2008
45.459
+0.959
2.16%
jan 1, 2009
44.712
-0.746
-1.64%
jan 1, 2010
43.268
-1.444
-3.23%
jan 1, 2013
41.967
-1.301
-3.01%
jan 1, 2014
44.688
+2.721
6.48%
Ranking of countries by current statistics by years


Comments: