29
/
en
AIzaSyAYiBZKx7MnpbEhh9jyipgxe19OcubqV5w
April 1, 2024
132892
Finland
FIN
true
2
1
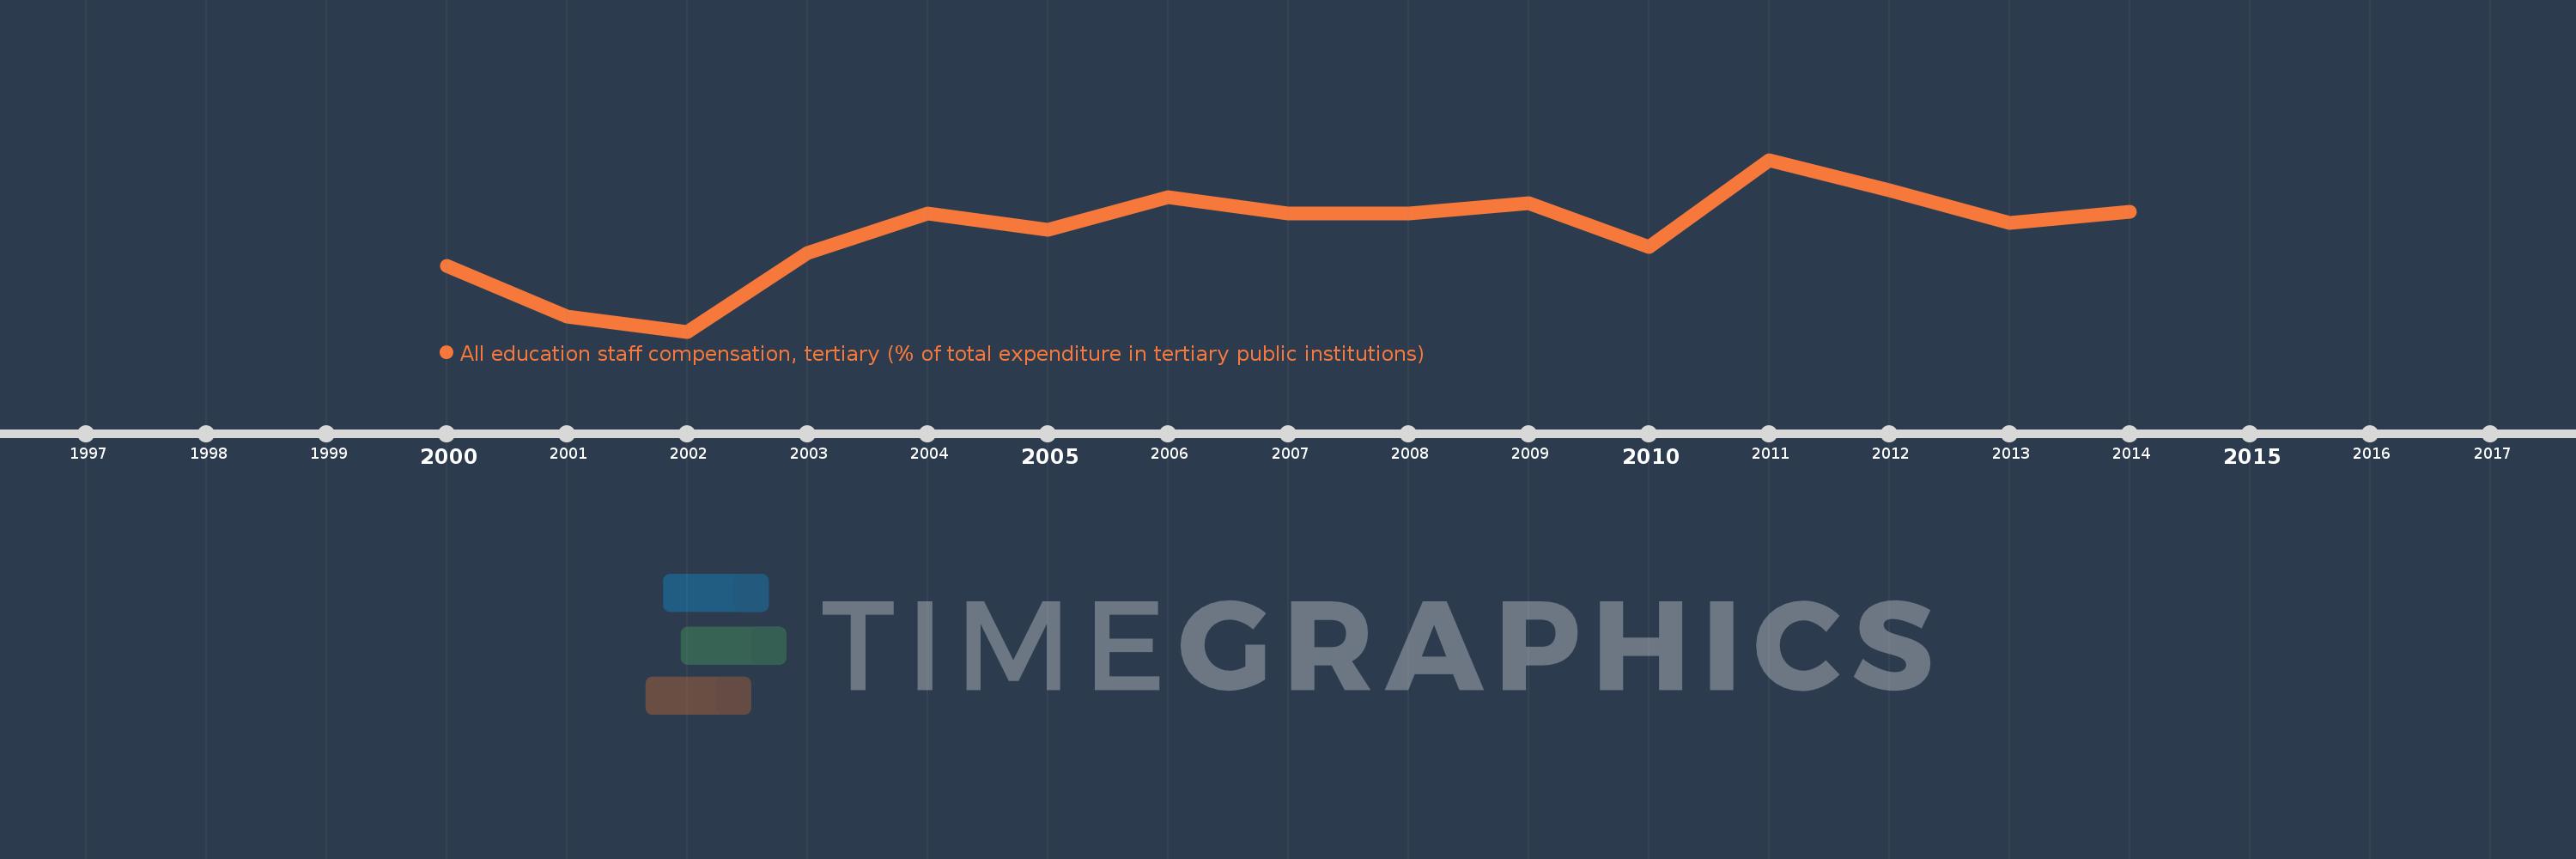
All education staff compensation, tertiary (% of total expenditure in tertiary public institutions)
2014,2013,2012,2011,2010,2009,2008,2007,2006,2005,2004,2003,2002,2001,2000
This statistics in other country:
Timeline:
This timeline shows a graph from 2000 to 2014 of Finland. No data until 1999. Number of actual observations by date: 15.
Source name:
World Development Indicators
Source organization:
United Nations Educational, Scientific, and Cultural Organization (UNESCO) Institute for Statistics.
Categories, topics:
Education
Last updated:
apr 23, 2017
Indicators value changes by year
At the date of observation
Value
Absolute change
Change from previous value
jan 1, 2000
58.0
+58.0
0.0%
jan 1, 2001
55.697
-2.302
-3.97%
jan 1, 2002
55.0
-0.697
-1.25%
jan 1, 2003
58.601
+3.6
6.55%
jan 1, 2004
60.398
+1.797
3.07%
jan 1, 2005
59.656
-0.741
-1.23%
jan 1, 2006
61.15
+1.494
2.5%
jan 1, 2007
60.4
-0.75
-1.23%
jan 1, 2008
60.395
-0.005
-0.01%
jan 1, 2009
60.867
+0.472
0.78%
jan 1, 2010
58.876
-1.991
-3.27%
jan 1, 2011
62.86
+3.984
6.77%
jan 1, 2012
61.454
-1.406
-2.24%
jan 1, 2013
59.965
-1.489
-2.42%
jan 1, 2014
60.464
+0.499
0.83%
Ranking of countries by current statistics by years


Comments: