29
/
en
AIzaSyAYiBZKx7MnpbEhh9jyipgxe19OcubqV5w
April 1, 2024
104560
Chile
CHL
true
2
1
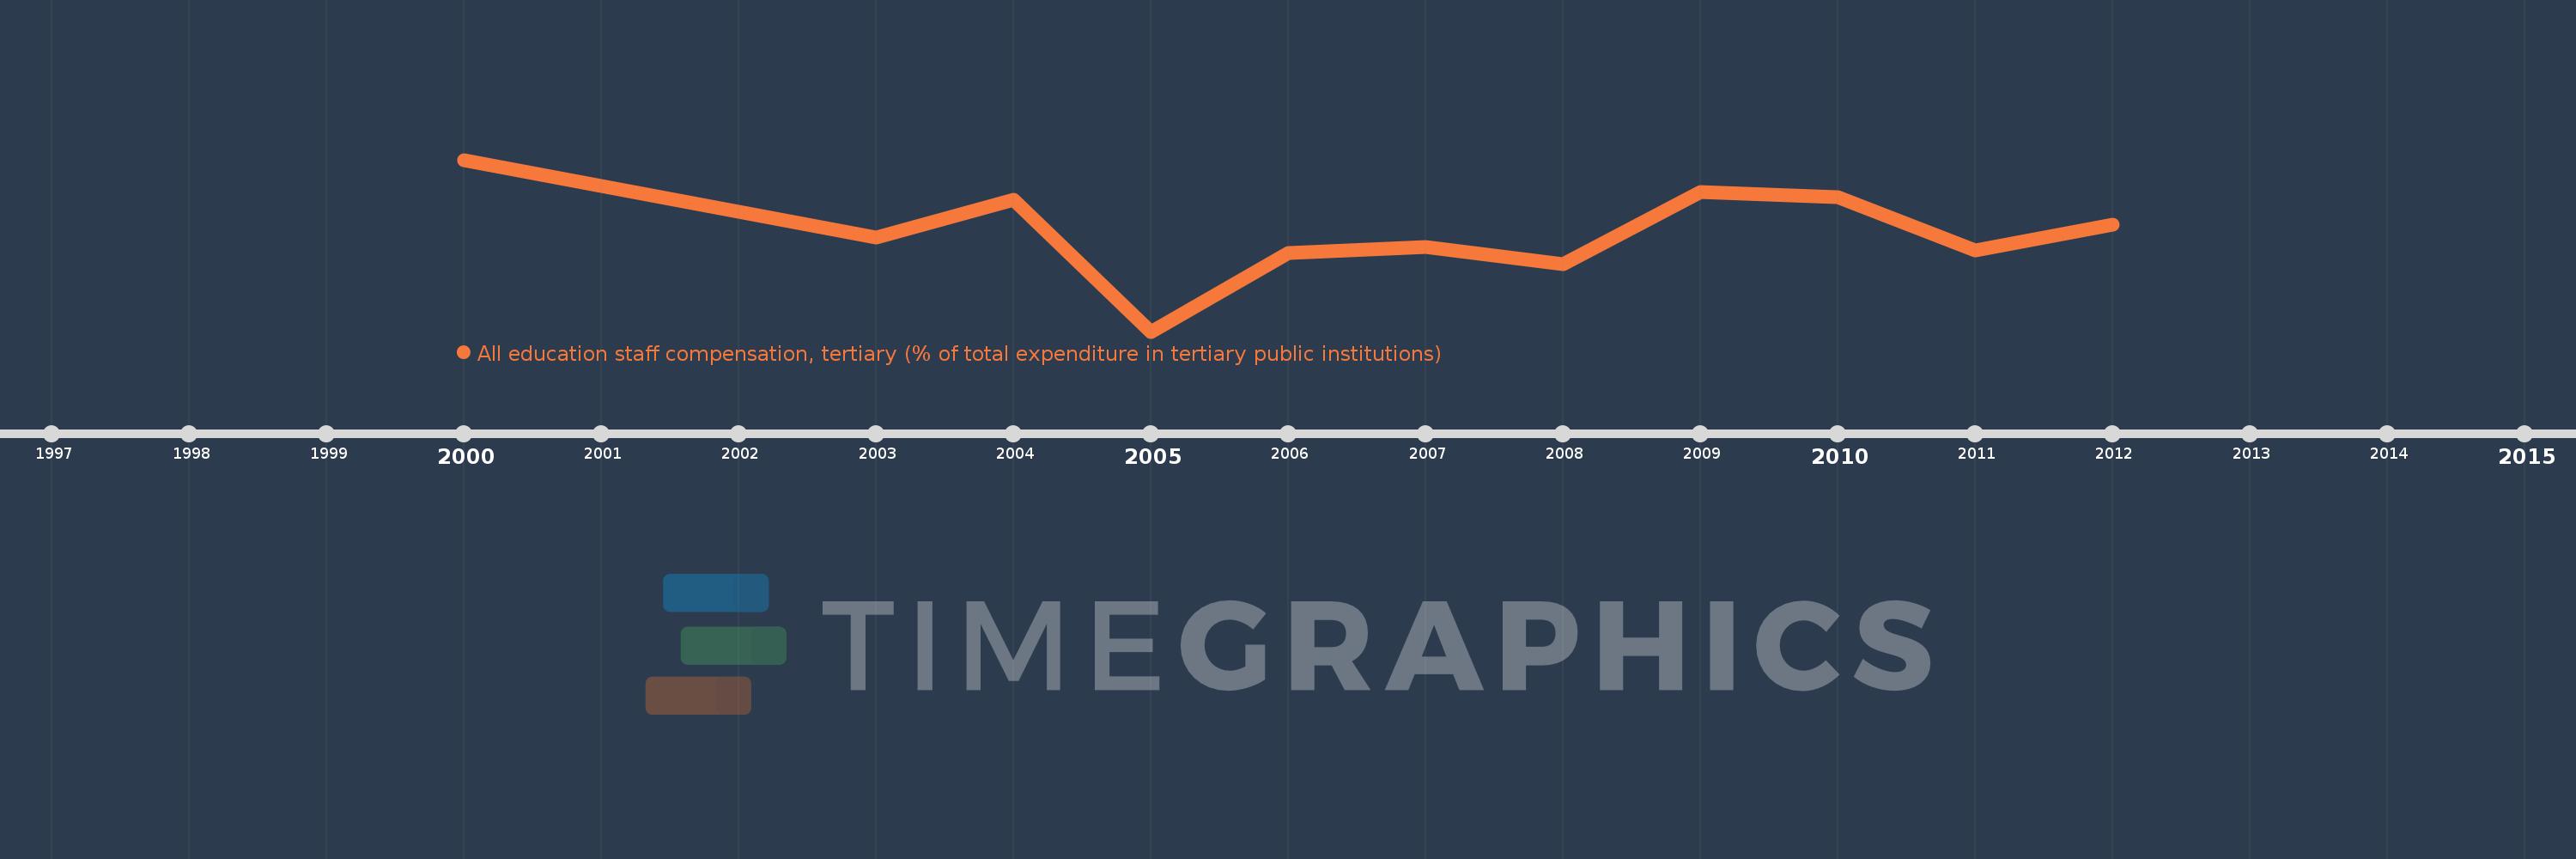
All education staff compensation, tertiary (% of total expenditure in tertiary public institutions)
2012,2011,2010,2009,2008,2007,2006,2005,2004,2003,2000
This statistics in other country:
Timeline:
This timeline shows a graph from 2000 to 2012 of Chile. No data until 1999. Number of actual observations by date: 11.
Source name:
World Development Indicators
Source organization:
United Nations Educational, Scientific, and Cultural Organization (UNESCO) Institute for Statistics.
Categories, topics:
Education
Last updated:
apr 23, 2017
Indicators value changes by year
Minimum:
55.239
jan 1, 2005
Maximum:
63.695
jan 1, 2000
At the date of observation
Value
Absolute change
Change from previous value
jan 1, 2000
63.695
+63.695
0.0%
jan 1, 2003
59.854
-3.841
-6.03%
jan 1, 2004
61.729
+1.874
3.13%
jan 1, 2005
55.239
-6.49
-10.51%
jan 1, 2006
59.094
+3.855
6.98%
jan 1, 2007
59.407
+0.313
0.53%
jan 1, 2008
58.555
-0.852
-1.43%
jan 1, 2009
62.092
+3.537
6.04%
jan 1, 2010
61.857
-0.236
-0.38%
jan 1, 2011
59.24
-2.616
-4.23%
jan 1, 2012
60.487
+1.247
2.11%
Ranking of countries by current statistics by years


Comments: