29
/
en
AIzaSyAYiBZKx7MnpbEhh9jyipgxe19OcubqV5w
April 1, 2024
133848
France
FRA
true
2
1
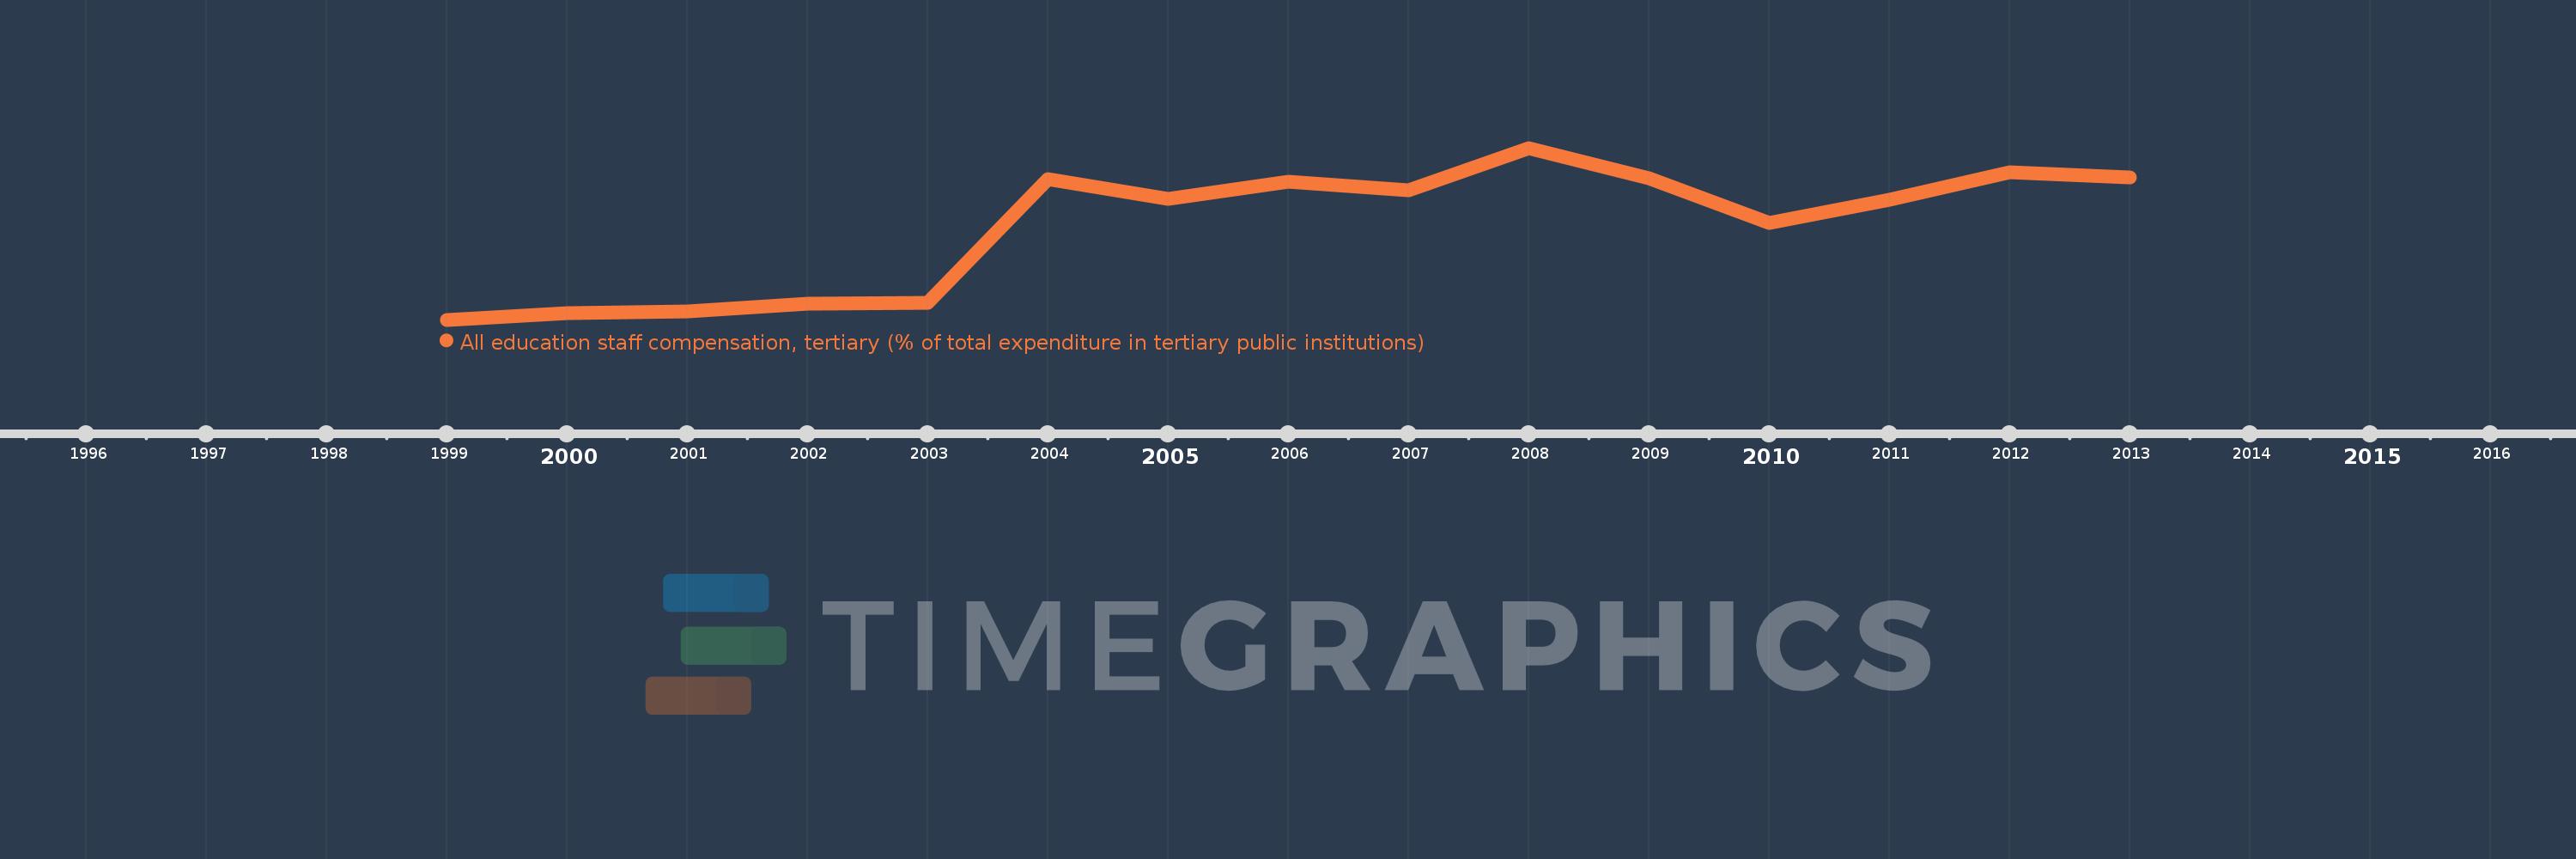
All education staff compensation, tertiary (% of total expenditure in tertiary public institutions)
2013,2012,2011,2010,2009,2008,2007,2006,2005,2004,2003,2002,2001,2000,1999
This statistics in other country:
Timeline:
This timeline shows a graph from 1999 to 2013 of France. No data until 1998. Number of actual observations by date: 15.
Source name:
World Development Indicators
Source organization:
United Nations Educational, Scientific, and Cultural Organization (UNESCO) Institute for Statistics.
Categories, topics:
Education
Last updated:
apr 23, 2017
Indicators value changes by year
Maximum:
74.482
jan 1, 2008
At the date of observation
Value
Absolute change
Change from previous value
jan 1, 1999
64.72
+64.72
0.0%
jan 1, 2000
65.077
+0.357
0.55%
jan 1, 2001
65.188
+0.111
0.17%
jan 1, 2002
65.639
+0.451
0.69%
jan 1, 2003
65.694
+0.056
0.08%
jan 1, 2004
72.727
+7.033
10.7%
jan 1, 2005
71.595
-1.132
-1.56%
jan 1, 2006
72.581
+0.986
1.38%
jan 1, 2007
72.068
-0.513
-0.71%
jan 1, 2008
74.482
+2.414
3.35%
jan 1, 2009
72.737
-1.745
-2.34%
jan 1, 2010
70.221
-2.516
-3.46%
jan 1, 2011
71.556
+1.335
1.9%
jan 1, 2012
73.103
+1.547
2.16%
jan 1, 2013
72.819
-0.284
-0.39%
Ranking of countries by current statistics by years


Comments: