29
/es/
es
AIzaSyAYiBZKx7MnpbEhh9jyipgxe19OcubqV5w
April 1, 2024
95166
Burkina Faso
BFA
true
2
1
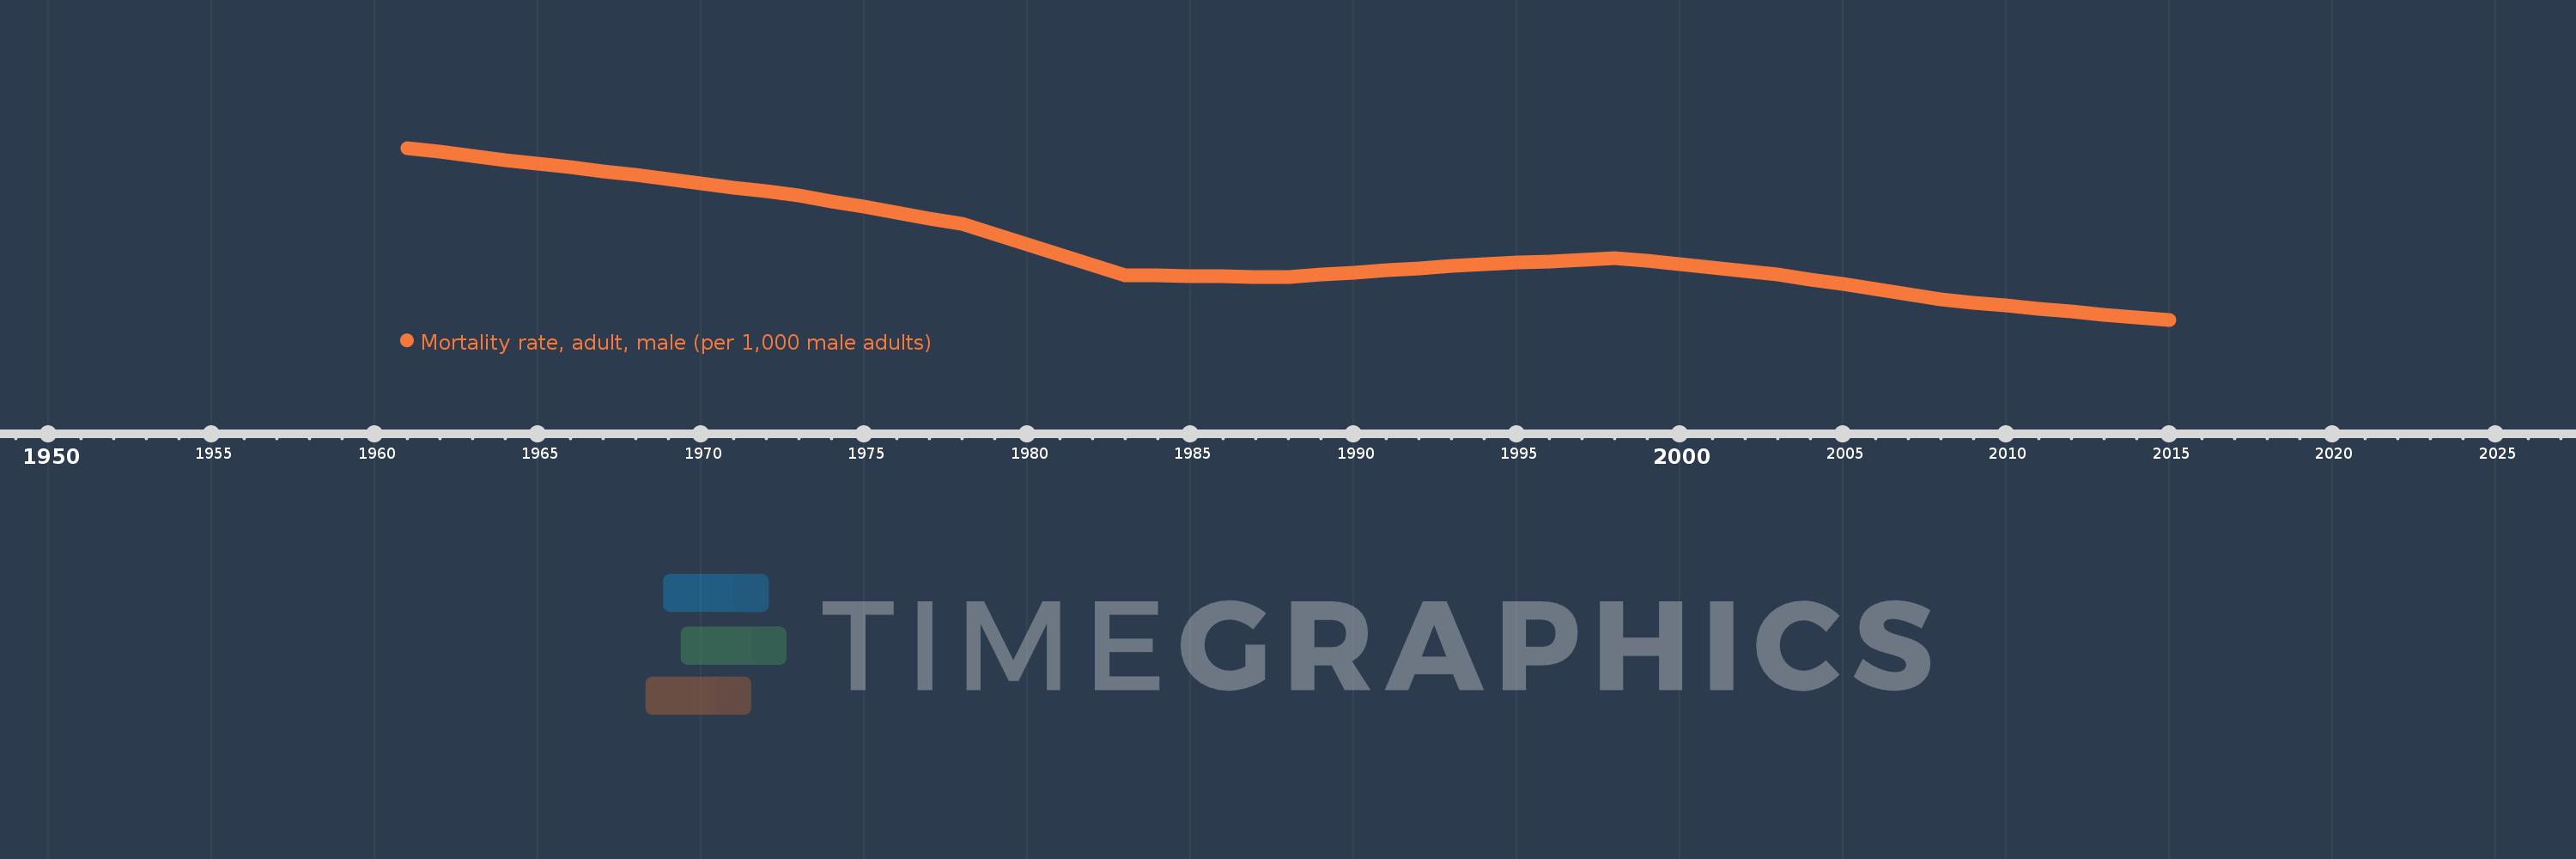
Mortality rate, adult, male (per 1,000 male adults)
2015,2014,2013,2012,2011,2010,2009,2008,2007,2006,2005,2004,2003,2002,2001,2000,1999,1998,1997,1996,1995,1994,1993,1992,1991,1990,1989,1988,1987,1986,1985,1984,1983,1982,1981,1980,1979,1978,1977,1976,1975,1974,1973,1972,1971,1970,1969,1968,1967,1966,1965,1964,1963,1962,1961
Estas estadísticas en otros países:
AfghanistanAlbaniaAlgeriaAngolaAntigua and BarbudaArab WorldArgentinaArmeniaArubaAustraliaAustriaAzerbaijanBahamas, TheBahrainBangladeshBarbadosBelarusBelgiumBelizeBeninBhutanBoliviaBosnia and HerzegovinaBotswanaBrazilBrunei DarussalamBulgariaBurkina FasoBurundiCabo VerdeCambodiaCameroonCanadaCaribbean small statesCentral African RepublicCentral Europe and the BalticsChadChannel IslandsChileChinaColombiaComorosCongo, Dem. Rep.Congo, Rep.Costa RicaCote d'IvoireCroatiaCubaCuracaoCyprusCzech RepublicDenmarkDjiboutiDominicaDominican RepublicEarly-demographic dividendEast Asia & PacificEast Asia & Pacific (excluding high income)East Asia & Pacific (IDA & IBRD countries)EcuadorEgypt, Arab Rep.El SalvadorEquatorial GuineaEritreaEstoniaEthiopiaEuro areaEurope & Central AsiaEurope & Central Asia (excluding high income)Europe & Central Asia (IDA & IBRD countries)European UnionFijiFinlandFragile and conflict affected situationsFranceFrench PolynesiaGabonGambia, TheGeorgiaGermanyGhanaGreeceGreenlandGrenadaGuamGuatemalaGuineaGuinea-BissauGuyanaHaitiHeavily indebted poor countries (HIPC)High incomeHondurasHong Kong SAR, ChinaHungaryIBRD onlyIcelandIDA & IBRD totalIDA blendIDA onlyIDA totalIndiaIndonesiaIran, Islamic Rep.IraqIrelandIsraelItalyJamaicaJapanJordanKazakhstanKenyaKiribatiKorea, Dem. People’s Rep.Korea, Rep.KuwaitKyrgyz RepublicLao PDRLate-demographic dividendLatin America & Caribbean Latin America & Caribbean (excluding high income)Latin America & the Caribbean (IDA & IBRD countries)LatviaLeast developed countries: UN classificationLebanonLesothoLiberiaLibyaLithuaniaLow & middle incomeLow incomeLower middle incomeLuxembourgMacao SAR, ChinaMacedonia, FYRMadagascarMalawiMalaysiaMaldivesMaliMaltaMarshall IslandsMauritaniaMauritiusMexicoMicronesia, Fed. Sts.Middle East & North AfricaMiddle East & North Africa (excluding high income)Middle East & North Africa (IDA & IBRD countries)Middle incomeMoldovaMongoliaMontenegroMoroccoMozambiqueMyanmarNamibiaNepalNetherlandsNew CaledoniaNew ZealandNicaraguaNigerNigeriaNorth AmericaNorwayOECD membersOmanOther small statesPacific island small statesPakistanPanamaPapua New GuineaParaguayPeruPhilippinesPolandPortugalPost-demographic dividendPre-demographic dividendPuerto RicoQatarRomaniaRussian FederationRwandaSamoaSao Tome and PrincipeSaudi ArabiaSenegalSerbiaSeychellesSierra LeoneSingaporeSlovak RepublicSloveniaSmall statesSolomon IslandsSomaliaSouth AfricaSouth AsiaSouth Asia (IDA & IBRD)South SudanSpainSri LankaSt. Kitts and NevisSt. LuciaSt. Vincent and the GrenadinesSub-Saharan Africa Sub-Saharan Africa (excluding high income)Sub-Saharan Africa (IDA & IBRD countries)SudanSurinameSwazilandSwedenSwitzerlandSyrian Arab RepublicTajikistanTanzaniaThailandTimor-LesteTogoTongaTrinidad and TobagoTunisiaTurkeyTurkmenistanUgandaUkraineUnited Arab EmiratesUnited KingdomUnited StatesUpper middle incomeUruguayUzbekistanVanuatuVenezuela, RBVietnamVirgin Islands (U.S.)West Bank and GazaWorldYemen, Rep.ZambiaZimbabwe línea de tiempo (timeline):
En esta escala de tiempo se presenta un gráfico de 1961 y 2015 de Burkina Faso. Los datos de 1960 están ausentes. El número de observaciones reales por fecha: 55.
Fuente (nombre):
Indicadores del desarrollo mundial
Fuente (organización):
(1) United Nations Population Division. World Population Prospects. New York, United Nations, Department of Economic and Social Affairs (advanced Excel tables). Available at http://esa.un.org/wpp/unpp/panel_population.htm, (2) University of California, Berkeley, and Max Planck Institute for Demographic Research. Human Mortality Database. [ www.mortality.org or www.humanmortality.de].
Categorías:
Health, Gender
Se ha actualizado:
23 abr 2017 año
Los indicadores de los cambios de valor en los últimos años
Mínimo:
278.968
1 ene 2015 año
Máximo:
543.058
1 ene 1961 año
A la fecha de observación
Valor
Cambio absoluto
El cambio con respecto al valor anterior
1 ene 1961 año
543.058
+543.058
0.0%
1 ene 1962 año
536.847
-6.211
-1.14%
1 ene 1963 año
530.636
-6.211
-1.16%
1 ene 1964 año
524.746
-5.89
-1.11%
1 ene 1965 año
518.855
-5.891
-1.12%
1 ene 1966 año
512.965
-5.89
-1.14%
1 ene 1967 año
507.074
-5.891
-1.15%
1 ene 1968 año
501.183
-5.891
-1.16%
1 ene 1969 año
494.945
-6.238
-1.24%
1 ene 1970 año
488.707
-6.238
-1.26%
1 ene 1971 año
482.469
-6.238
-1.28%
1 ene 1972 año
476.231
-6.238
-1.29%
1 ene 1973 año
469.993
-6.238
-1.31%
1 ene 1974 año
461.204
-8.789
-1.87%
1 ene 1975 año
452.414
-8.79
-1.91%
1 ene 1976 año
443.625
-8.789
-1.94%
1 ene 1977 año
434.836
-8.789
-1.98%
1 ene 1978 año
426.047
-8.789
-2.02%
1 ene 1979 año
410.306
-15.741
-3.69%
1 ene 1980 año
394.566
-15.74
-3.84%
1 ene 1981 año
378.825
-15.741
-3.99%
1 ene 1982 año
363.084
-15.741
-4.16%
1 ene 1983 año
347.344
-15.74
-4.34%
1 ene 1984 año
346.792
-0.552
-0.16%
1 ene 1985 año
346.24
-0.552
-0.16%
1 ene 1986 año
345.688
-0.552
-0.16%
1 ene 1987 año
345.136
-0.552
-0.16%
1 ene 1988 año
344.584
-0.552
-0.16%
1 ene 1989 año
347.923
+3.339
0.97%
1 ene 1990 año
351.262
+3.339
0.96%
1 ene 1991 año
354.602
+3.34
0.95%
1 ene 1992 año
357.941
+3.339
0.94%
1 ene 1993 año
361.28
+3.339
0.93%
1 ene 1994 año
363.839
+2.559
0.71%
1 ene 1995 año
366.398
+2.559
0.7%
1 ene 1996 año
368.957
+2.559
0.7%
1 ene 1997 año
371.516
+2.559
0.69%
1 ene 1998 año
374.075
+2.559
0.69%
1 ene 1999 año
369.035
-5.04
-1.35%
1 ene 2000 año
363.995
-5.04
-1.37%
1 ene 2001 año
358.956
-5.039
-1.38%
1 ene 2002 año
353.916
-5.04
-1.4%
1 ene 2003 año
348.876
-5.04
-1.42%
1 ene 2004 año
341.156
-7.72
-2.21%
1 ene 2005 año
333.435
-7.721
-2.26%
1 ene 2006 año
325.715
-7.72
-2.32%
1 ene 2007 año
317.995
-7.72
-2.37%
1 ene 2008 año
310.275
-7.72
-2.43%
1 ene 2009 año
305.533
-4.742
-1.53%
1 ene 2010 año
300.79
-4.743
-1.55%
1 ene 2011 año
296.047
-4.743
-1.58%
1 ene 2012 año
291.305
-4.742
-1.6%
1 ene 2013 año
286.562
-4.743
-1.63%
1 ene 2014 año
282.765
-3.797
-1.33%
1 ene 2015 año
278.968
-3.797
-1.34%
Ranking de los países por los datos estadísticos actuales


Comentarios: