29
/es/
es
AIzaSyAYiBZKx7MnpbEhh9jyipgxe19OcubqV5w
April 1, 2024
216750
Pakistan
PAK
true
2
1
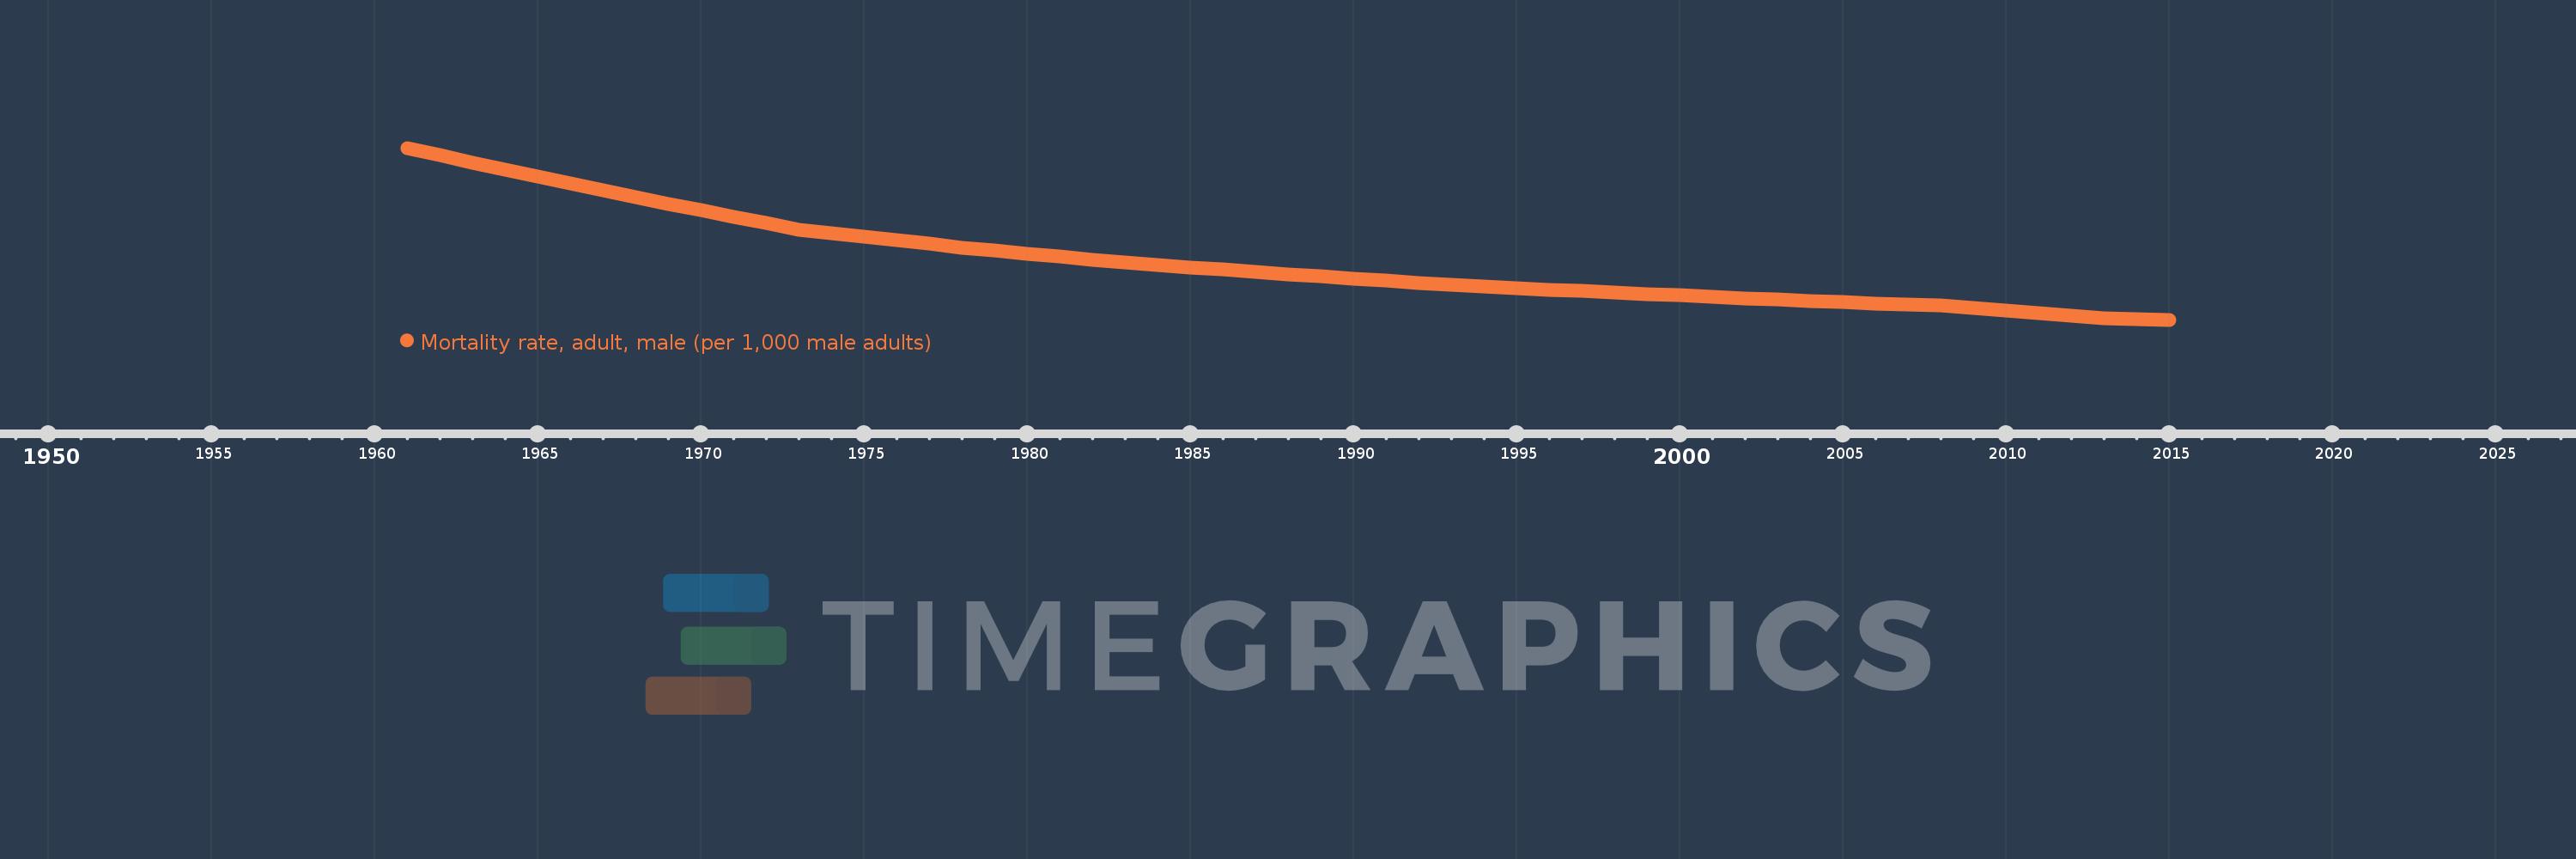
Mortality rate, adult, male (per 1,000 male adults)
2015,2014,2013,2012,2011,2010,2009,2008,2007,2006,2005,2004,2003,2002,2001,2000,1999,1998,1997,1996,1995,1994,1993,1992,1991,1990,1989,1988,1987,1986,1985,1984,1983,1982,1981,1980,1979,1978,1977,1976,1975,1974,1973,1972,1971,1970,1969,1968,1967,1966,1965,1964,1963,1962,1961
Estas estadísticas en otros países:
AfghanistanAlbaniaAlgeriaAngolaAntigua and BarbudaArab WorldArgentinaArmeniaArubaAustraliaAustriaAzerbaijanBahamas, TheBahrainBangladeshBarbadosBelarusBelgiumBelizeBeninBhutanBoliviaBosnia and HerzegovinaBotswanaBrazilBrunei DarussalamBulgariaBurkina FasoBurundiCabo VerdeCambodiaCameroonCanadaCaribbean small statesCentral African RepublicCentral Europe and the BalticsChadChannel IslandsChileChinaColombiaComorosCongo, Dem. Rep.Congo, Rep.Costa RicaCote d'IvoireCroatiaCubaCuracaoCyprusCzech RepublicDenmarkDjiboutiDominicaDominican RepublicEarly-demographic dividendEast Asia & PacificEast Asia & Pacific (excluding high income)East Asia & Pacific (IDA & IBRD countries)EcuadorEgypt, Arab Rep.El SalvadorEquatorial GuineaEritreaEstoniaEthiopiaEuro areaEurope & Central AsiaEurope & Central Asia (excluding high income)Europe & Central Asia (IDA & IBRD countries)European UnionFijiFinlandFragile and conflict affected situationsFranceFrench PolynesiaGabonGambia, TheGeorgiaGermanyGhanaGreeceGreenlandGrenadaGuamGuatemalaGuineaGuinea-BissauGuyanaHaitiHeavily indebted poor countries (HIPC)High incomeHondurasHong Kong SAR, ChinaHungaryIBRD onlyIcelandIDA & IBRD totalIDA blendIDA onlyIDA totalIndiaIndonesiaIran, Islamic Rep.IraqIrelandIsraelItalyJamaicaJapanJordanKazakhstanKenyaKiribatiKorea, Dem. People’s Rep.Korea, Rep.KuwaitKyrgyz RepublicLao PDRLate-demographic dividendLatin America & Caribbean Latin America & Caribbean (excluding high income)Latin America & the Caribbean (IDA & IBRD countries)LatviaLeast developed countries: UN classificationLebanonLesothoLiberiaLibyaLithuaniaLow & middle incomeLow incomeLower middle incomeLuxembourgMacao SAR, ChinaMacedonia, FYRMadagascarMalawiMalaysiaMaldivesMaliMaltaMarshall IslandsMauritaniaMauritiusMexicoMicronesia, Fed. Sts.Middle East & North AfricaMiddle East & North Africa (excluding high income)Middle East & North Africa (IDA & IBRD countries)Middle incomeMoldovaMongoliaMontenegroMoroccoMozambiqueMyanmarNamibiaNepalNetherlandsNew CaledoniaNew ZealandNicaraguaNigerNigeriaNorth AmericaNorwayOECD membersOmanOther small statesPacific island small statesPakistanPanamaPapua New GuineaParaguayPeruPhilippinesPolandPortugalPost-demographic dividendPre-demographic dividendPuerto RicoQatarRomaniaRussian FederationRwandaSamoaSao Tome and PrincipeSaudi ArabiaSenegalSerbiaSeychellesSierra LeoneSingaporeSlovak RepublicSloveniaSmall statesSolomon IslandsSomaliaSouth AfricaSouth AsiaSouth Asia (IDA & IBRD)South SudanSpainSri LankaSt. Kitts and NevisSt. LuciaSt. Vincent and the GrenadinesSub-Saharan Africa Sub-Saharan Africa (excluding high income)Sub-Saharan Africa (IDA & IBRD countries)SudanSurinameSwazilandSwedenSwitzerlandSyrian Arab RepublicTajikistanTanzaniaThailandTimor-LesteTogoTongaTrinidad and TobagoTunisiaTurkeyTurkmenistanUgandaUkraineUnited Arab EmiratesUnited KingdomUnited StatesUpper middle incomeUruguayUzbekistanVanuatuVenezuela, RBVietnamVirgin Islands (U.S.)West Bank and GazaWorldYemen, Rep.ZambiaZimbabwe línea de tiempo (timeline):
En esta escala de tiempo se presenta un gráfico de 1961 y 2015 de Pakistan. Los datos de 1960 están ausentes. El número de observaciones reales por fecha: 55.
Fuente (nombre):
Indicadores del desarrollo mundial
Fuente (organización):
(1) United Nations Population Division. World Population Prospects. New York, United Nations, Department of Economic and Social Affairs (advanced Excel tables). Available at http://esa.un.org/wpp/unpp/panel_population.htm, (2) University of California, Berkeley, and Max Planck Institute for Demographic Research. Human Mortality Database. [ www.mortality.org or www.humanmortality.de].
Categorías:
Health, Gender
Se ha actualizado:
23 abr 2017 año
Los indicadores de los cambios de valor en los últimos años
Mínimo:
179.038
1 ene 2015 año
Máximo:
353.771
1 ene 1961 año
A la fecha de observación
Valor
Cambio absoluto
El cambio con respecto al valor anterior
1 ene 1961 año
353.771
+353.771
0.0%
1 ene 1962 año
346.166
-7.605
-2.15%
1 ene 1963 año
338.562
-7.604
-2.2%
1 ene 1964 año
331.559
-7.003
-2.07%
1 ene 1965 año
324.555
-7.004
-2.11%
1 ene 1966 año
317.552
-7.003
-2.16%
1 ene 1967 año
310.549
-7.003
-2.21%
1 ene 1968 año
303.546
-7.003
-2.26%
1 ene 1969 año
297.009
-6.537
-2.15%
1 ene 1970 año
290.472
-6.537
-2.2%
1 ene 1971 año
283.935
-6.537
-2.25%
1 ene 1972 año
277.398
-6.537
-2.3%
1 ene 1973 año
270.861
-6.537
-2.36%
1 ene 1974 año
267.194
-3.667
-1.35%
1 ene 1975 año
263.527
-3.667
-1.37%
1 ene 1976 año
259.859
-3.668
-1.39%
1 ene 1977 año
256.192
-3.667
-1.41%
1 ene 1978 año
252.525
-3.667
-1.43%
1 ene 1979 año
249.434
-3.091
-1.22%
1 ene 1980 año
246.344
-3.09
-1.24%
1 ene 1981 año
243.253
-3.091
-1.25%
1 ene 1982 año
240.162
-3.091
-1.27%
1 ene 1983 año
237.072
-3.09
-1.29%
1 ene 1984 año
234.703
-2.369
-1.0%
1 ene 1985 año
232.335
-2.368
-1.01%
1 ene 1986 año
229.966
-2.369
-1.02%
1 ene 1987 año
227.598
-2.368
-1.03%
1 ene 1988 año
225.23
-2.368
-1.04%
1 ene 1989 año
223.051
-2.179
-0.97%
1 ene 1990 año
220.872
-2.179
-0.98%
1 ene 1991 año
218.694
-2.178
-0.99%
1 ene 1992 año
216.515
-2.179
-1.0%
1 ene 1993 año
214.336
-2.179
-1.01%
1 ene 1994 año
212.789
-1.547
-0.72%
1 ene 1995 año
211.242
-1.547
-0.73%
1 ene 1996 año
209.695
-1.547
-0.73%
1 ene 1997 año
208.148
-1.547
-0.74%
1 ene 1998 año
206.601
-1.547
-0.74%
1 ene 1999 año
205.173
-1.428
-0.69%
1 ene 2000 año
203.745
-1.428
-0.7%
1 ene 2001 año
202.317
-1.428
-0.7%
1 ene 2002 año
200.889
-1.428
-0.71%
1 ene 2003 año
199.461
-1.428
-0.71%
1 ene 2004 año
198.213
-1.248
-0.63%
1 ene 2005 año
196.965
-1.248
-0.63%
1 ene 2006 año
195.716
-1.249
-0.63%
1 ene 2007 año
194.468
-1.248
-0.64%
1 ene 2008 año
193.22
-1.248
-0.64%
1 ene 2009 año
190.689
-2.531
-1.31%
1 ene 2010 año
188.157
-2.532
-1.33%
1 ene 2011 año
185.625
-2.532
-1.35%
1 ene 2012 año
183.093
-2.532
-1.36%
1 ene 2013 año
180.561
-2.532
-1.38%
1 ene 2014 año
179.8
-0.761
-0.42%
1 ene 2015 año
179.038
-0.762
-0.42%
Ranking de los países por los datos estadísticos actuales


Comentarios: