29
/es/
es
AIzaSyAYiBZKx7MnpbEhh9jyipgxe19OcubqV5w
April 1, 2024
93879
Bulgaria
BGR
true
2
1
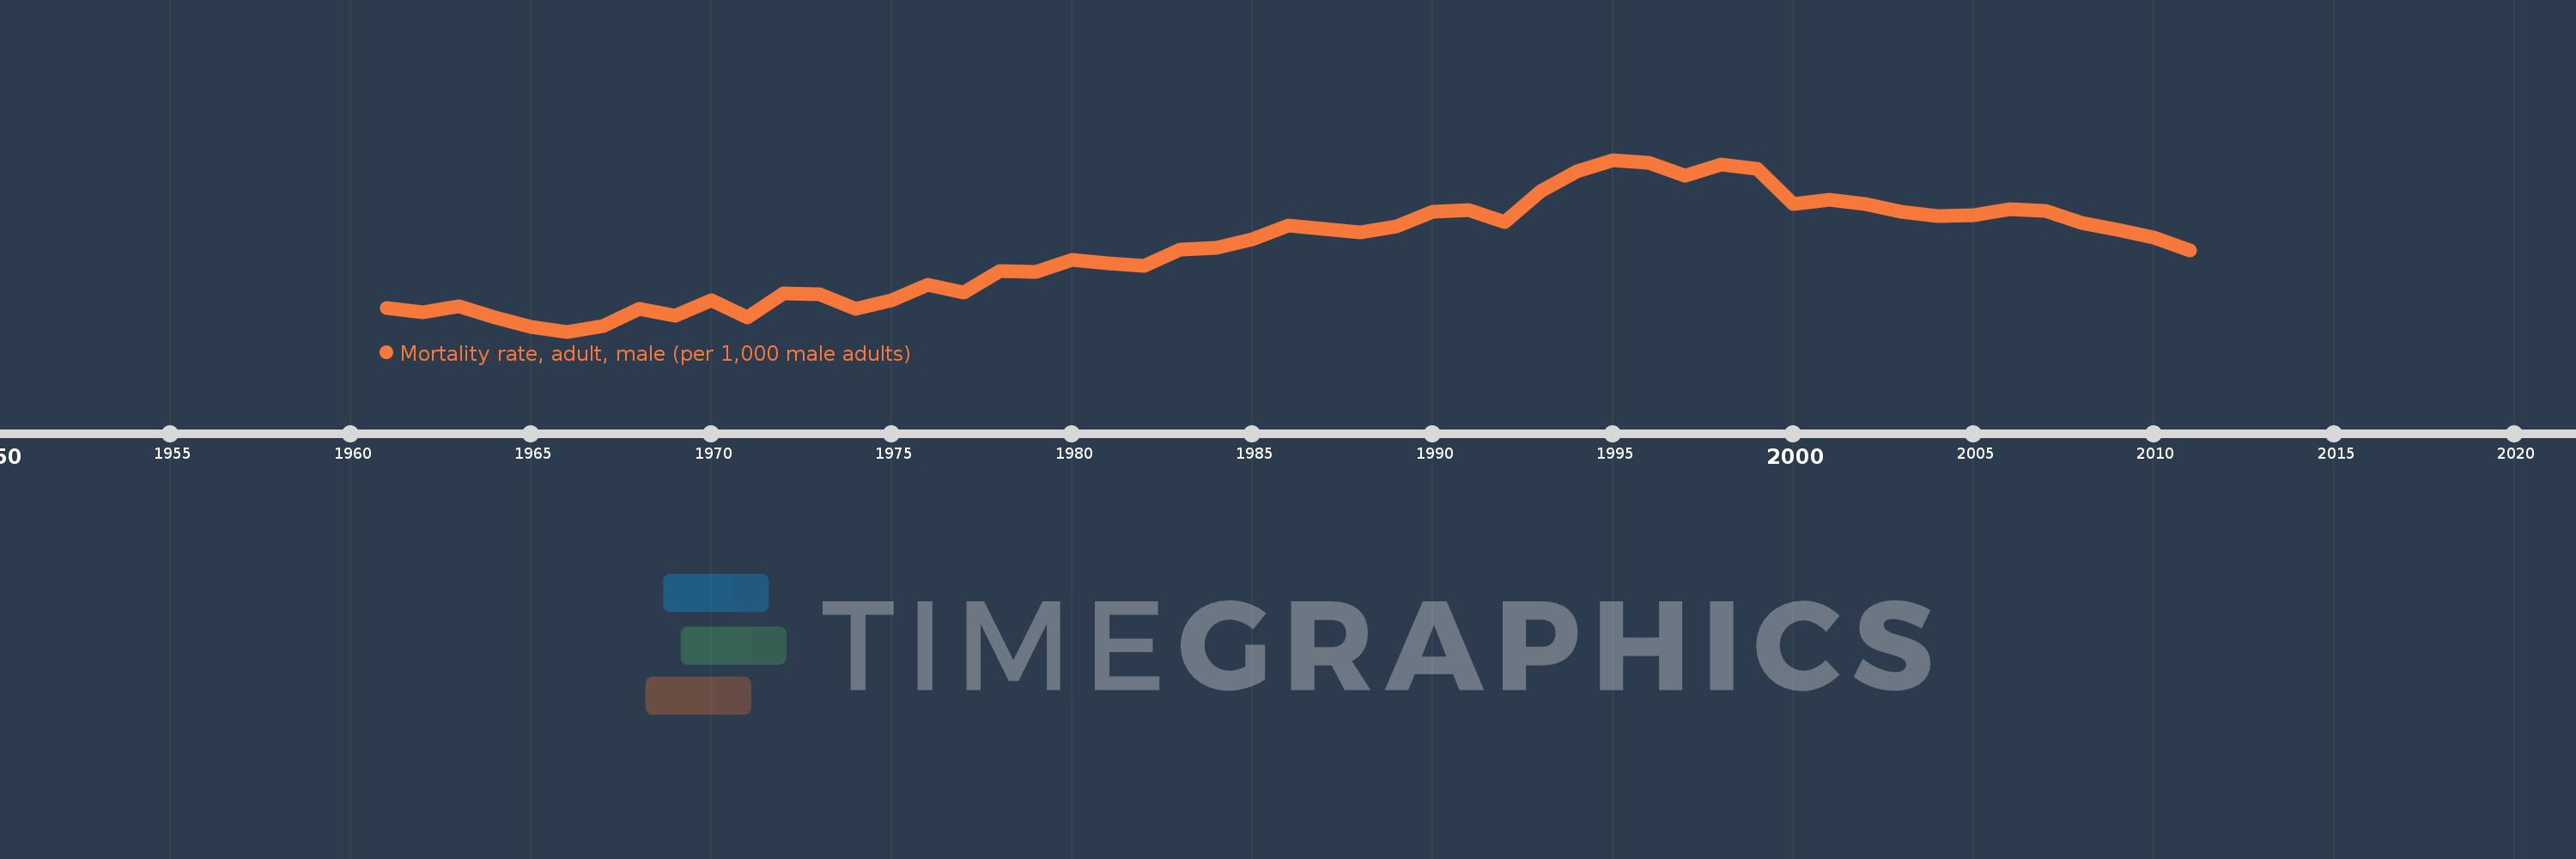
Mortality rate, adult, male (per 1,000 male adults)
2011,2010,2009,2008,2007,2006,2005,2004,2003,2002,2001,2000,1999,1998,1997,1996,1995,1994,1993,1992,1991,1990,1989,1988,1987,1986,1985,1984,1983,1982,1981,1980,1979,1978,1977,1976,1975,1974,1973,1972,1971,1970,1969,1968,1967,1966,1965,1964,1963,1962,1961
Estas estadísticas en otros países:
AfghanistanAlbaniaAlgeriaAngolaAntigua and BarbudaArab WorldArgentinaArmeniaArubaAustraliaAustriaAzerbaijanBahamas, TheBahrainBangladeshBarbadosBelarusBelgiumBelizeBeninBhutanBoliviaBosnia and HerzegovinaBotswanaBrazilBrunei DarussalamBulgariaBurkina FasoBurundiCabo VerdeCambodiaCameroonCanadaCaribbean small statesCentral African RepublicCentral Europe and the BalticsChadChannel IslandsChileChinaColombiaComorosCongo, Dem. Rep.Congo, Rep.Costa RicaCote d'IvoireCroatiaCubaCuracaoCyprusCzech RepublicDenmarkDjiboutiDominicaDominican RepublicEarly-demographic dividendEast Asia & PacificEast Asia & Pacific (excluding high income)East Asia & Pacific (IDA & IBRD countries)EcuadorEgypt, Arab Rep.El SalvadorEquatorial GuineaEritreaEstoniaEthiopiaEuro areaEurope & Central AsiaEurope & Central Asia (excluding high income)Europe & Central Asia (IDA & IBRD countries)European UnionFijiFinlandFragile and conflict affected situationsFranceFrench PolynesiaGabonGambia, TheGeorgiaGermanyGhanaGreeceGreenlandGrenadaGuamGuatemalaGuineaGuinea-BissauGuyanaHaitiHeavily indebted poor countries (HIPC)High incomeHondurasHong Kong SAR, ChinaHungaryIBRD onlyIcelandIDA & IBRD totalIDA blendIDA onlyIDA totalIndiaIndonesiaIran, Islamic Rep.IraqIrelandIsraelItalyJamaicaJapanJordanKazakhstanKenyaKiribatiKorea, Dem. People’s Rep.Korea, Rep.KuwaitKyrgyz RepublicLao PDRLate-demographic dividendLatin America & Caribbean Latin America & Caribbean (excluding high income)Latin America & the Caribbean (IDA & IBRD countries)LatviaLeast developed countries: UN classificationLebanonLesothoLiberiaLibyaLithuaniaLow & middle incomeLow incomeLower middle incomeLuxembourgMacao SAR, ChinaMacedonia, FYRMadagascarMalawiMalaysiaMaldivesMaliMaltaMarshall IslandsMauritaniaMauritiusMexicoMicronesia, Fed. Sts.Middle East & North AfricaMiddle East & North Africa (excluding high income)Middle East & North Africa (IDA & IBRD countries)Middle incomeMoldovaMongoliaMontenegroMoroccoMozambiqueMyanmarNamibiaNepalNetherlandsNew CaledoniaNew ZealandNicaraguaNigerNigeriaNorth AmericaNorwayOECD membersOmanOther small statesPacific island small statesPakistanPanamaPapua New GuineaParaguayPeruPhilippinesPolandPortugalPost-demographic dividendPre-demographic dividendPuerto RicoQatarRomaniaRussian FederationRwandaSamoaSao Tome and PrincipeSaudi ArabiaSenegalSerbiaSeychellesSierra LeoneSingaporeSlovak RepublicSloveniaSmall statesSolomon IslandsSomaliaSouth AfricaSouth AsiaSouth Asia (IDA & IBRD)South SudanSpainSri LankaSt. Kitts and NevisSt. LuciaSt. Vincent and the GrenadinesSub-Saharan Africa Sub-Saharan Africa (excluding high income)Sub-Saharan Africa (IDA & IBRD countries)SudanSurinameSwazilandSwedenSwitzerlandSyrian Arab RepublicTajikistanTanzaniaThailandTimor-LesteTogoTongaTrinidad and TobagoTunisiaTurkeyTurkmenistanUgandaUkraineUnited Arab EmiratesUnited KingdomUnited StatesUpper middle incomeUruguayUzbekistanVanuatuVenezuela, RBVietnamVirgin Islands (U.S.)West Bank and GazaWorldYemen, Rep.ZambiaZimbabwe línea de tiempo (timeline):
En esta escala de tiempo se presenta un gráfico de 1961 y 2011 de Bulgaria. Los datos de 1960 están ausentes. El número de observaciones reales por fecha: 51.
Fuente (nombre):
Indicadores del desarrollo mundial
Fuente (organización):
(1) United Nations Population Division. World Population Prospects. New York, United Nations, Department of Economic and Social Affairs (advanced Excel tables). Available at http://esa.un.org/wpp/unpp/panel_population.htm, (2) University of California, Berkeley, and Max Planck Institute for Demographic Research. Human Mortality Database. [ www.mortality.org or www.humanmortality.de].
Categorías:
Health, Gender
Se ha actualizado:
23 abr 2017 año
Los indicadores de los cambios de valor en los últimos años
Mínimo:
151.941
1 ene 1966 año
Máximo:
246.884
1 ene 1995 año
A la fecha de observación
Valor
Cambio absoluto
El cambio con respecto al valor anterior
1 ene 1961 año
164.938
+164.938
0.0%
1 ene 1962 año
162.435
-2.503
-1.52%
1 ene 1963 año
165.986
+3.551
2.19%
1 ene 1964 año
159.618
-6.368
-3.84%
1 ene 1965 año
154.488
-5.13
-3.21%
1 ene 1966 año
151.941
-2.547
-1.65%
1 ene 1967 año
155.165
+3.224
2.12%
1 ene 1968 año
164.552
+9.387
6.05%
1 ene 1969 año
160.668
-3.884
-2.36%
1 ene 1970 año
169.163
+8.495
5.29%
1 ene 1971 año
159.814
-9.349
-5.53%
1 ene 1972 año
172.981
+13.167
8.24%
1 ene 1973 año
172.606
-0.375
-0.22%
1 ene 1974 año
164.524
-8.082
-4.68%
1 ene 1975 año
169.469
+4.945
3.01%
1 ene 1976 año
177.643
+8.174
4.82%
1 ene 1977 año
173.613
-4.03
-2.27%
1 ene 1978 año
185.61
+11.997
6.91%
1 ene 1979 año
184.761
-0.849
-0.46%
1 ene 1980 año
191.368
+6.607
3.58%
1 ene 1981 año
189.866
-1.502
-0.78%
1 ene 1982 año
188.381
-1.485
-0.78%
1 ene 1983 año
197.424
+9.043
4.8%
1 ene 1984 año
198.215
+0.791
0.4%
1 ene 1985 año
202.751
+4.536
2.29%
1 ene 1986 año
210.525
+7.774
3.83%
1 ene 1987 año
208.622
-1.903
-0.9%
1 ene 1988 año
206.571
-2.051
-0.98%
1 ene 1989 año
210.298
+3.727
1.8%
1 ene 1990 año
217.95
+7.652
3.64%
1 ene 1991 año
219.326
+1.376
0.63%
1 ene 1992 año
212.529
-6.797
-3.1%
1 ene 1993 año
229.761
+17.232
8.11%
1 ene 1994 año
240.436
+10.675
4.65%
1 ene 1995 año
246.884
+6.448
2.68%
1 ene 1996 año
245.326
-1.558
-0.63%
1 ene 1997 año
238.237
-7.089
-2.89%
1 ene 1998 año
244.314
+6.077
2.55%
1 ene 1999 año
241.743
-2.571
-1.05%
1 ene 2000 año
222.568
-19.175
-7.93%
1 ene 2001 año
224.896
+2.328
1.05%
1 ene 2002 año
222.531
-2.365
-1.05%
1 ene 2003 año
218.314
-4.217
-1.9%
1 ene 2004 año
216.006
-2.308
-1.06%
1 ene 2005 año
216.239
+0.233
0.11%
1 ene 2006 año
219.686
+3.447
1.59%
1 ene 2007 año
218.5
-1.186
-0.54%
1 ene 2008 año
211.997
-6.503
-2.98%
1 ene 2009 año
208.254
-3.743
-1.77%
1 ene 2010 año
203.861
-4.393
-2.11%
1 ene 2011 año
196.963
-6.898
-3.38%
Ranking de los países por los datos estadísticos actuales


Comentarios: