29
/es/
es
AIzaSyAYiBZKx7MnpbEhh9jyipgxe19OcubqV5w
April 1, 2024
104451
Channel Islands
CHI
true
2
1
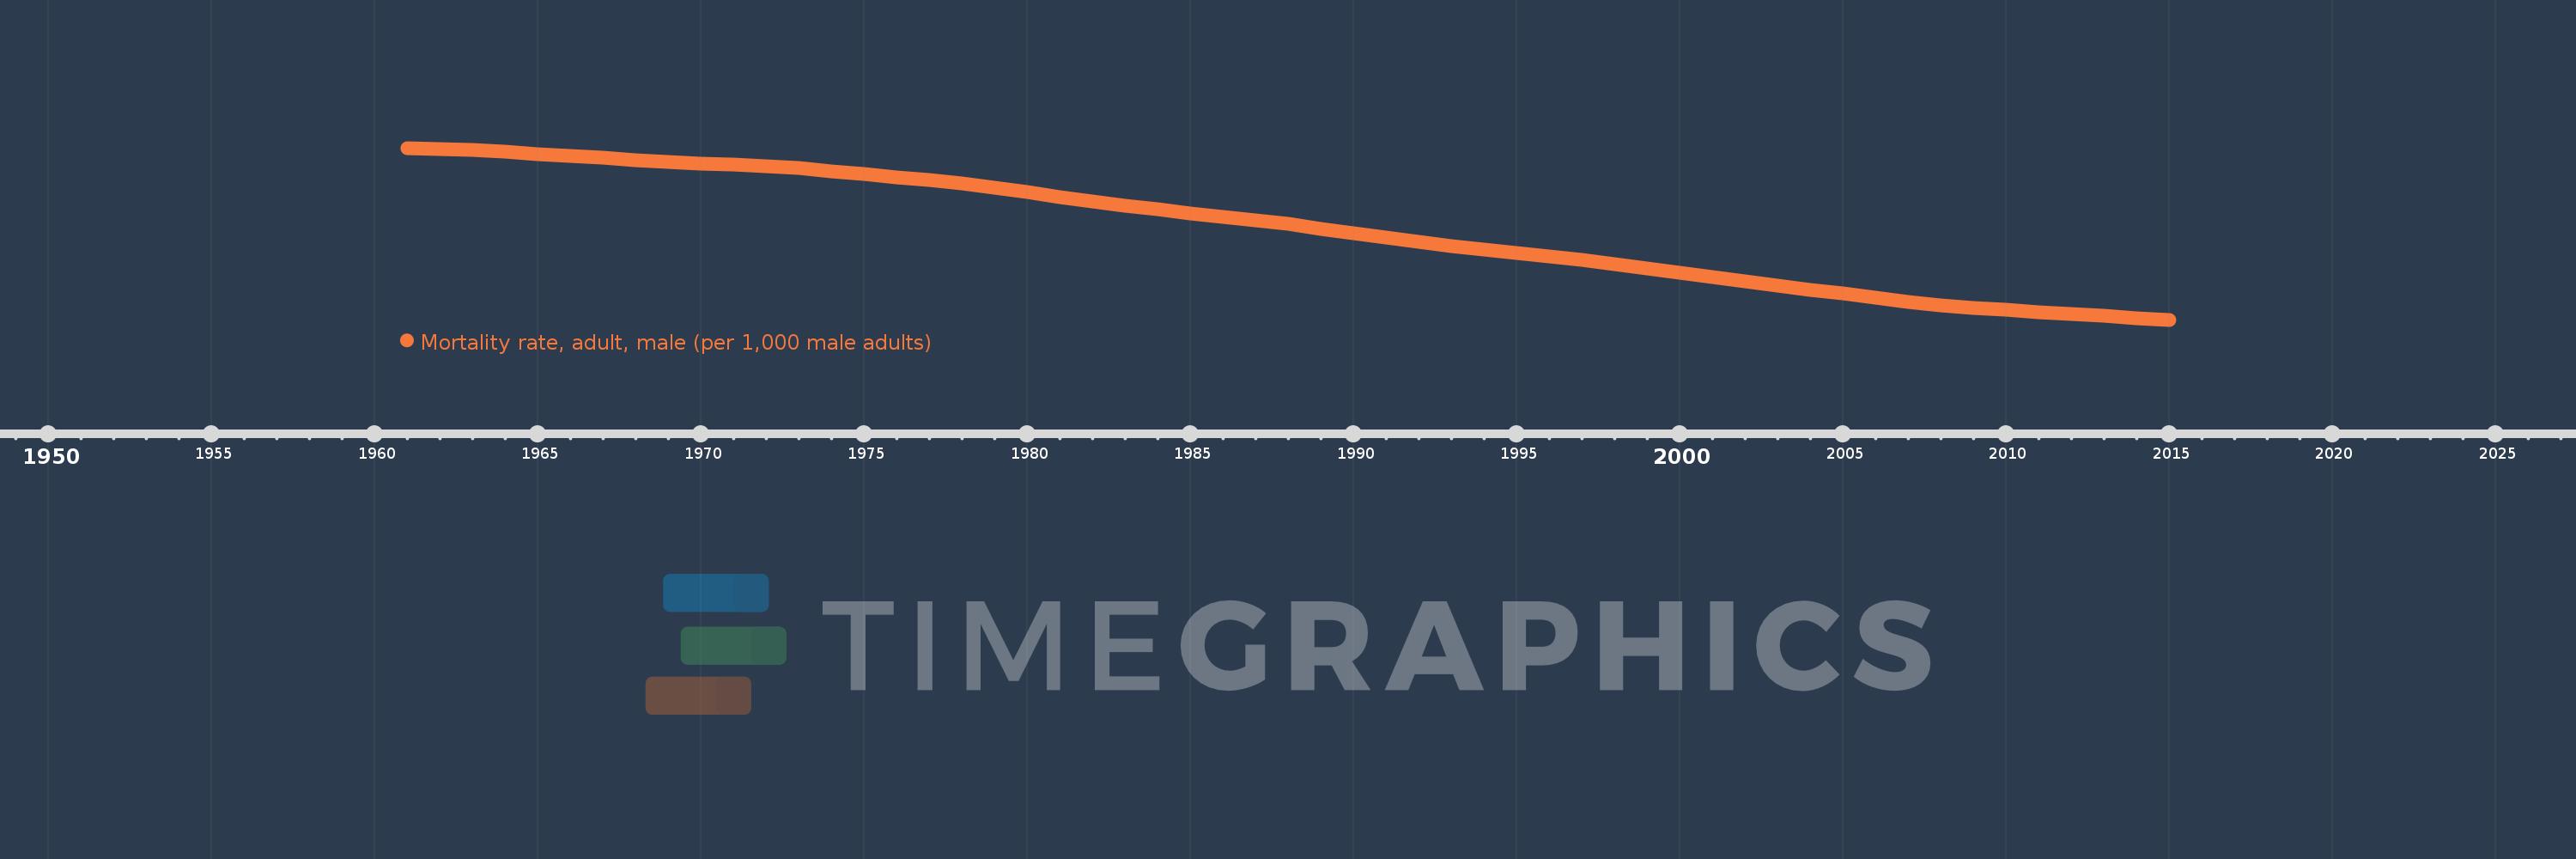
Mortality rate, adult, male (per 1,000 male adults)
2015,2014,2013,2012,2011,2010,2009,2008,2007,2006,2005,2004,2003,2002,2001,2000,1999,1998,1997,1996,1995,1994,1993,1992,1991,1990,1989,1988,1987,1986,1985,1984,1983,1982,1981,1980,1979,1978,1977,1976,1975,1974,1973,1972,1971,1970,1969,1968,1967,1966,1965,1964,1963,1962,1961
Estas estadísticas en otros países:
AfghanistanAlbaniaAlgeriaAngolaAntigua and BarbudaArab WorldArgentinaArmeniaArubaAustraliaAustriaAzerbaijanBahamas, TheBahrainBangladeshBarbadosBelarusBelgiumBelizeBeninBhutanBoliviaBosnia and HerzegovinaBotswanaBrazilBrunei DarussalamBulgariaBurkina FasoBurundiCabo VerdeCambodiaCameroonCanadaCaribbean small statesCentral African RepublicCentral Europe and the BalticsChadChannel IslandsChileChinaColombiaComorosCongo, Dem. Rep.Congo, Rep.Costa RicaCote d'IvoireCroatiaCubaCuracaoCyprusCzech RepublicDenmarkDjiboutiDominicaDominican RepublicEarly-demographic dividendEast Asia & PacificEast Asia & Pacific (excluding high income)East Asia & Pacific (IDA & IBRD countries)EcuadorEgypt, Arab Rep.El SalvadorEquatorial GuineaEritreaEstoniaEthiopiaEuro areaEurope & Central AsiaEurope & Central Asia (excluding high income)Europe & Central Asia (IDA & IBRD countries)European UnionFijiFinlandFragile and conflict affected situationsFranceFrench PolynesiaGabonGambia, TheGeorgiaGermanyGhanaGreeceGreenlandGrenadaGuamGuatemalaGuineaGuinea-BissauGuyanaHaitiHeavily indebted poor countries (HIPC)High incomeHondurasHong Kong SAR, ChinaHungaryIBRD onlyIcelandIDA & IBRD totalIDA blendIDA onlyIDA totalIndiaIndonesiaIran, Islamic Rep.IraqIrelandIsraelItalyJamaicaJapanJordanKazakhstanKenyaKiribatiKorea, Dem. People’s Rep.Korea, Rep.KuwaitKyrgyz RepublicLao PDRLate-demographic dividendLatin America & Caribbean Latin America & Caribbean (excluding high income)Latin America & the Caribbean (IDA & IBRD countries)LatviaLeast developed countries: UN classificationLebanonLesothoLiberiaLibyaLithuaniaLow & middle incomeLow incomeLower middle incomeLuxembourgMacao SAR, ChinaMacedonia, FYRMadagascarMalawiMalaysiaMaldivesMaliMaltaMarshall IslandsMauritaniaMauritiusMexicoMicronesia, Fed. Sts.Middle East & North AfricaMiddle East & North Africa (excluding high income)Middle East & North Africa (IDA & IBRD countries)Middle incomeMoldovaMongoliaMontenegroMoroccoMozambiqueMyanmarNamibiaNepalNetherlandsNew CaledoniaNew ZealandNicaraguaNigerNigeriaNorth AmericaNorwayOECD membersOmanOther small statesPacific island small statesPakistanPanamaPapua New GuineaParaguayPeruPhilippinesPolandPortugalPost-demographic dividendPre-demographic dividendPuerto RicoQatarRomaniaRussian FederationRwandaSamoaSao Tome and PrincipeSaudi ArabiaSenegalSerbiaSeychellesSierra LeoneSingaporeSlovak RepublicSloveniaSmall statesSolomon IslandsSomaliaSouth AfricaSouth AsiaSouth Asia (IDA & IBRD)South SudanSpainSri LankaSt. Kitts and NevisSt. LuciaSt. Vincent and the GrenadinesSub-Saharan Africa Sub-Saharan Africa (excluding high income)Sub-Saharan Africa (IDA & IBRD countries)SudanSurinameSwazilandSwedenSwitzerlandSyrian Arab RepublicTajikistanTanzaniaThailandTimor-LesteTogoTongaTrinidad and TobagoTunisiaTurkeyTurkmenistanUgandaUkraineUnited Arab EmiratesUnited KingdomUnited StatesUpper middle incomeUruguayUzbekistanVanuatuVenezuela, RBVietnamVirgin Islands (U.S.)West Bank and GazaWorldYemen, Rep.ZambiaZimbabwe línea de tiempo (timeline):
En esta escala de tiempo se presenta un gráfico de 1961 y 2015 de Channel Islands. Los datos de 1960 están ausentes. El número de observaciones reales por fecha: 55.
Fuente (nombre):
Indicadores del desarrollo mundial
Fuente (organización):
(1) United Nations Population Division. World Population Prospects. New York, United Nations, Department of Economic and Social Affairs (advanced Excel tables). Available at http://esa.un.org/wpp/unpp/panel_population.htm, (2) University of California, Berkeley, and Max Planck Institute for Demographic Research. Human Mortality Database. [ www.mortality.org or www.humanmortality.de].
Categorías:
Health, Gender
Se ha actualizado:
23 abr 2017 año
Los indicadores de los cambios de valor en los últimos años
Mínimo:
63.096
1 ene 2015 año
Máximo:
183.374
1 ene 1961 año
A la fecha de observación
Valor
Cambio absoluto
El cambio con respecto al valor anterior
1 ene 1961 año
183.374
+183.374
0.0%
1 ene 1962 año
182.651
-0.723
-0.39%
1 ene 1963 año
181.927
-0.724
-0.4%
1 ene 1964 año
180.527
-1.4
-0.77%
1 ene 1965 año
179.127
-1.4
-0.78%
1 ene 1966 año
177.726
-1.401
-0.78%
1 ene 1967 año
176.326
-1.4
-0.79%
1 ene 1968 año
174.925
-1.401
-0.79%
1 ene 1969 año
173.797
-1.128
-0.64%
1 ene 1970 año
172.668
-1.129
-0.65%
1 ene 1971 año
171.539
-1.129
-0.65%
1 ene 1972 año
170.411
-1.128
-0.66%
1 ene 1973 año
169.282
-1.129
-0.66%
1 ene 1974 año
167.169
-2.113
-1.25%
1 ene 1975 año
165.055
-2.114
-1.26%
1 ene 1976 año
162.942
-2.113
-1.28%
1 ene 1977 año
160.828
-2.114
-1.3%
1 ene 1978 año
158.715
-2.113
-1.31%
1 ene 1979 año
155.543
-3.172
-2.0%
1 ene 1980 año
152.371
-3.172
-2.04%
1 ene 1981 año
149.198
-3.173
-2.08%
1 ene 1982 año
146.026
-3.172
-2.13%
1 ene 1983 año
142.854
-3.172
-2.17%
1 ene 1984 año
140.282
-2.572
-1.8%
1 ene 1985 año
137.71
-2.572
-1.83%
1 ene 1986 año
135.137
-2.573
-1.87%
1 ene 1987 año
132.565
-2.572
-1.9%
1 ene 1988 año
129.993
-2.572
-1.94%
1 ene 1989 año
126.96
-3.033
-2.33%
1 ene 1990 año
123.927
-3.033
-2.39%
1 ene 1991 año
120.895
-3.032
-2.45%
1 ene 1992 año
117.862
-3.033
-2.51%
1 ene 1993 año
114.829
-3.033
-2.57%
1 ene 1994 año
112.308
-2.521
-2.2%
1 ene 1995 año
109.787
-2.521
-2.24%
1 ene 1996 año
107.266
-2.521
-2.3%
1 ene 1997 año
104.744
-2.522
-2.35%
1 ene 1998 año
102.223
-2.521
-2.41%
1 ene 1999 año
99.147
-3.076
-3.01%
1 ene 2000 año
96.07
-3.077
-3.1%
1 ene 2001 año
92.994
-3.076
-3.2%
1 ene 2002 año
89.917
-3.077
-3.31%
1 ene 2003 año
86.841
-3.076
-3.42%
1 ene 2004 año
84.064
-2.777
-3.2%
1 ene 2005 año
81.288
-2.776
-3.3%
1 ene 2006 año
78.512
-2.776
-3.42%
1 ene 2007 año
75.736
-2.776
-3.54%
1 ene 2008 año
72.96
-2.776
-3.67%
1 ene 2009 año
71.493
-1.467
-2.01%
1 ene 2010 año
70.027
-1.466
-2.05%
1 ene 2011 año
68.561
-1.466
-2.09%
1 ene 2012 año
67.094
-1.467
-2.14%
1 ene 2013 año
65.628
-1.466
-2.18%
1 ene 2014 año
64.362
-1.266
-1.93%
1 ene 2015 año
63.096
-1.266
-1.97%
Ranking de los países por los datos estadísticos actuales


Comentarios: