29
/es/
es
AIzaSyAYiBZKx7MnpbEhh9jyipgxe19OcubqV5w
April 1, 2024
82026
Belgium
BEL
true
2
1
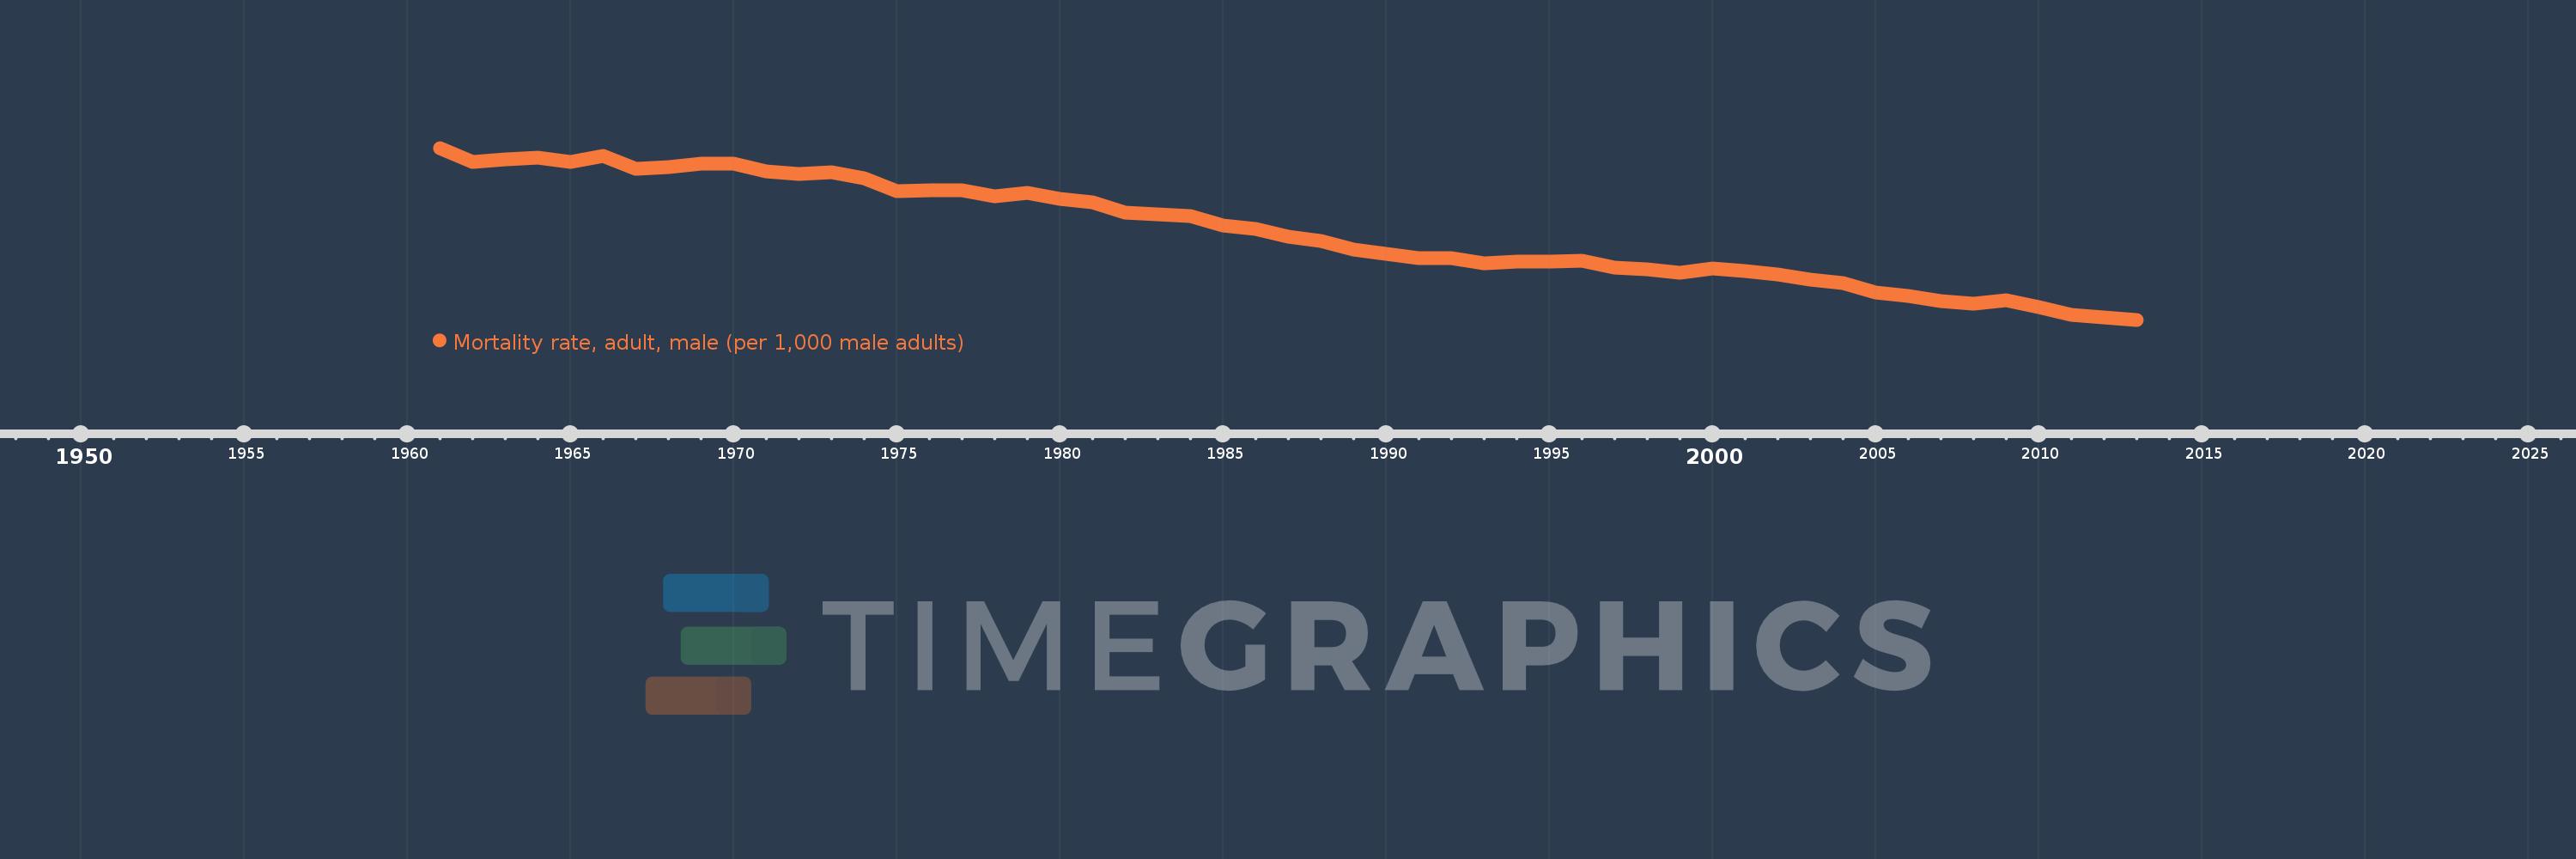
Mortality rate, adult, male (per 1,000 male adults)
2013,2012,2011,2010,2009,2008,2007,2006,2005,2004,2003,2002,2001,2000,1999,1998,1997,1996,1995,1994,1993,1992,1991,1990,1989,1988,1987,1986,1985,1984,1983,1982,1981,1980,1979,1978,1977,1976,1975,1974,1973,1972,1971,1970,1969,1968,1967,1966,1965,1964,1963,1962,1961
Estas estadísticas en otros países:
AfghanistanAlbaniaAlgeriaAngolaAntigua and BarbudaArab WorldArgentinaArmeniaArubaAustraliaAustriaAzerbaijanBahamas, TheBahrainBangladeshBarbadosBelarusBelgiumBelizeBeninBhutanBoliviaBosnia and HerzegovinaBotswanaBrazilBrunei DarussalamBulgariaBurkina FasoBurundiCabo VerdeCambodiaCameroonCanadaCaribbean small statesCentral African RepublicCentral Europe and the BalticsChadChannel IslandsChileChinaColombiaComorosCongo, Dem. Rep.Congo, Rep.Costa RicaCote d'IvoireCroatiaCubaCuracaoCyprusCzech RepublicDenmarkDjiboutiDominicaDominican RepublicEarly-demographic dividendEast Asia & PacificEast Asia & Pacific (excluding high income)East Asia & Pacific (IDA & IBRD countries)EcuadorEgypt, Arab Rep.El SalvadorEquatorial GuineaEritreaEstoniaEthiopiaEuro areaEurope & Central AsiaEurope & Central Asia (excluding high income)Europe & Central Asia (IDA & IBRD countries)European UnionFijiFinlandFragile and conflict affected situationsFranceFrench PolynesiaGabonGambia, TheGeorgiaGermanyGhanaGreeceGreenlandGrenadaGuamGuatemalaGuineaGuinea-BissauGuyanaHaitiHeavily indebted poor countries (HIPC)High incomeHondurasHong Kong SAR, ChinaHungaryIBRD onlyIcelandIDA & IBRD totalIDA blendIDA onlyIDA totalIndiaIndonesiaIran, Islamic Rep.IraqIrelandIsraelItalyJamaicaJapanJordanKazakhstanKenyaKiribatiKorea, Dem. People’s Rep.Korea, Rep.KuwaitKyrgyz RepublicLao PDRLate-demographic dividendLatin America & Caribbean Latin America & Caribbean (excluding high income)Latin America & the Caribbean (IDA & IBRD countries)LatviaLeast developed countries: UN classificationLebanonLesothoLiberiaLibyaLithuaniaLow & middle incomeLow incomeLower middle incomeLuxembourgMacao SAR, ChinaMacedonia, FYRMadagascarMalawiMalaysiaMaldivesMaliMaltaMarshall IslandsMauritaniaMauritiusMexicoMicronesia, Fed. Sts.Middle East & North AfricaMiddle East & North Africa (excluding high income)Middle East & North Africa (IDA & IBRD countries)Middle incomeMoldovaMongoliaMontenegroMoroccoMozambiqueMyanmarNamibiaNepalNetherlandsNew CaledoniaNew ZealandNicaraguaNigerNigeriaNorth AmericaNorwayOECD membersOmanOther small statesPacific island small statesPakistanPanamaPapua New GuineaParaguayPeruPhilippinesPolandPortugalPost-demographic dividendPre-demographic dividendPuerto RicoQatarRomaniaRussian FederationRwandaSamoaSao Tome and PrincipeSaudi ArabiaSenegalSerbiaSeychellesSierra LeoneSingaporeSlovak RepublicSloveniaSmall statesSolomon IslandsSomaliaSouth AfricaSouth AsiaSouth Asia (IDA & IBRD)South SudanSpainSri LankaSt. Kitts and NevisSt. LuciaSt. Vincent and the GrenadinesSub-Saharan Africa Sub-Saharan Africa (excluding high income)Sub-Saharan Africa (IDA & IBRD countries)SudanSurinameSwazilandSwedenSwitzerlandSyrian Arab RepublicTajikistanTanzaniaThailandTimor-LesteTogoTongaTrinidad and TobagoTunisiaTurkeyTurkmenistanUgandaUkraineUnited Arab EmiratesUnited KingdomUnited StatesUpper middle incomeUruguayUzbekistanVanuatuVenezuela, RBVietnamVirgin Islands (U.S.)West Bank and GazaWorldYemen, Rep.ZambiaZimbabwe línea de tiempo (timeline):
En esta escala de tiempo se presenta un gráfico de 1961 y 2013 de Belgium. Los datos de 1960 están ausentes. El número de observaciones reales por fecha: 53.
Fuente (nombre):
Indicadores del desarrollo mundial
Fuente (organización):
(1) United Nations Population Division. World Population Prospects. New York, United Nations, Department of Economic and Social Affairs (advanced Excel tables). Available at http://esa.un.org/wpp/unpp/panel_population.htm, (2) University of California, Berkeley, and Max Planck Institute for Demographic Research. Human Mortality Database. [ www.mortality.org or www.humanmortality.de].
Categorías:
Health, Gender
Se ha actualizado:
23 abr 2017 año
Los indicadores de los cambios de valor en los últimos años
Mínimo:
98.987
1 ene 2013 año
Máximo:
209.304
1 ene 1961 año
A la fecha de observación
Valor
Cambio absoluto
El cambio con respecto al valor anterior
1 ene 1961 año
209.304
+209.304
0.0%
1 ene 1962 año
200.353
-8.951
-4.28%
1 ene 1963 año
201.733
+1.38
0.69%
1 ene 1964 año
203.094
+1.361
0.67%
1 ene 1965 año
200.216
-2.878
-1.42%
1 ene 1966 año
203.916
+3.7
1.85%
1 ene 1967 año
195.774
-8.142
-3.99%
1 ene 1968 año
196.98
+1.206
0.62%
1 ene 1969 año
198.983
+2.003
1.02%
1 ene 1970 año
199.271
+0.288
0.14%
1 ene 1971 año
194.035
-5.236
-2.63%
1 ene 1972 año
192.395
-1.64
-0.85%
1 ene 1973 año
193.861
+1.466
0.76%
1 ene 1974 año
189.712
-4.149
-2.14%
1 ene 1975 año
181.337
-8.375
-4.41%
1 ene 1976 año
182.274
+0.937
0.52%
1 ene 1977 año
182.113
-0.161
-0.09%
1 ene 1978 año
178.309
-3.804
-2.09%
1 ene 1979 año
180.55
+2.241
1.26%
1 ene 1980 año
176.354
-4.196
-2.32%
1 ene 1981 año
174.519
-1.835
-1.04%
1 ene 1982 año
167.993
-6.526
-3.74%
1 ene 1983 año
166.675
-1.318
-0.78%
1 ene 1984 año
165.371
-1.304
-0.78%
1 ene 1985 año
159.472
-5.899
-3.57%
1 ene 1986 año
157.056
-2.416
-1.51%
1 ene 1987 año
152.375
-4.681
-2.98%
1 ene 1988 año
149.779
-2.596
-1.7%
1 ene 1989 año
144.164
-5.615
-3.75%
1 ene 1990 año
141.117
-3.047
-2.11%
1 ene 1991 año
138.654
-2.463
-1.75%
1 ene 1992 año
138.299
-0.355
-0.26%
1 ene 1993 año
135.472
-2.827
-2.04%
1 ene 1994 año
136.602
+1.13
0.83%
1 ene 1995 año
136.398
-0.204
-0.15%
1 ene 1996 año
136.862
+0.464
0.34%
1 ene 1997 año
132.411
-4.451
-3.25%
1 ene 1998 año
131.231
-1.18
-0.89%
1 ene 1999 año
129.01
-2.221
-1.69%
1 ene 2000 año
131.756
+2.746
2.13%
1 ene 2001 año
130.295
-1.461
-1.11%
1 ene 2002 año
128.108
-2.187
-1.68%
1 ene 2003 año
124.795
-3.313
-2.59%
1 ene 2004 año
122.531
-2.264
-1.81%
1 ene 2005 año
116.553
-5.978
-4.88%
1 ene 2006 año
114.389
-2.164
-1.86%
1 ene 2007 año
110.936
-3.453
-3.02%
1 ene 2008 año
109.256
-1.68
-1.51%
1 ene 2009 año
111.642
+2.386
2.18%
1 ene 2010 año
107.226
-4.416
-3.96%
1 ene 2011 año
102.017
-5.209
-4.86%
1 ene 2012 año
100.339
-1.678
-1.64%
1 ene 2013 año
98.987
-1.352
-1.35%
Ranking de los países por los datos estadísticos actuales


Comentarios: